Download
1 / 54
540 likes | 684 Views
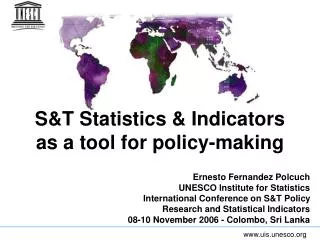
S&T Statistics & Indicators as a tool for policy-making. Ernesto Fernandez Polcuch UNESCO Institute for Statistics International Conference on S&T Policy Research and Statistical Indicators 08-10 November 2006 - Colombo, Sri Lanka. Structure of the presentation.

E N D
S&T Statistics & Indicatorsas a tool for policy-making Ernesto Fernandez PolcuchUNESCO Institute for StatisticsInternational Conference on S&T Policy Research and Statistical Indicators08-10 November 2006 - Colombo, Sri Lanka
Structure of the presentation • What information are we collecting at the international level • Why produce S&T statistics and indicators in the country • How to produce them
Researchers per million inhabitants, 2004 or latest available year 0 –100 101 – 300 301 –1000 1001 – 2000 2001 and above Data not available Source: UIS S&T database 2006 and estimates
Researchers per million inhabitants, 2004 or latest available year 0 –100 101 – 300 301 –1000 1001 and above Data not available Source: UIS S&T database 2006 and estimates
R&D Personnel in Asia, 2003 or latest available year Source: UIS S&T database 2006 FTE: Full-time equivalent, HC: Headcount, *partial data
R&D Personnel in Asia, 2003 or latest available year (continued) Source: UIS S&T database 2006 FTE: Full-time equivalent, HC: Headcount, *partial data, **different year
R&D Personnel in Africa, 2003 or latest available year FTE: Full-time equivalent, HC: Headcount, *partial data Source: UIS S&T database 2006
R&D Personnel in Americas and Oceania, 2003 or latest available year Source: UIS S&T database 2006 FTE: Full-time equivalent, HC: Headcount
R&D Personnel in Europe, 2003 or latest available year Source: UIS S&T database 2006 FTE: Full-time equivalent, HC: Headcount, *partial data, **different year FTE: Full-time equivalent, HC: Headcount, **different year
Researchers per million inhabitants in 2000 by principal regions/sub-regions Source: UIS estimates 2003 Note: Other Asia includes South Asia, South East Asia (excl. NIE), Arab states in Asia, Mongolia and Korea. Source: UIS estimates 2003
Shares of world researchers by regions, 2000 North Oceania America 1.4% 22.7% Latin America & Caribbean Asia 2.4% 38.5% Africa Europe 1.2% 33.8% Asia, Europe and North America represent 95% of world researchers whereas the other 5% is represented by Latin America & Caribbean, Oceania and Africa. Source: UIS estimates 2003
Researchers by sector of employment in Africa and Asia, 2003 or latest available year 100% 90% 80% 70% 60% 50% 40% 30% 20% 10% 0% Iran India China Japan Sudan Guinea Tunisia Uganda Pakistan Thailand Viet Nam Indonesia Singapore Philippines Azerbaijan Kyrgyzstan Kazakhstan South Africa Rep of Korea Asia Africa Business Enterprise Government Higher Education Private Non-Profit Non distributed Source: UIS S&T database 2006
Researchers by sector of employment in Americas, Europe and Oceania, 2003 or latest available year 100% 90% 80% 70% 60% 50% 40% 30% 20% 10% 0% USA Chile Brazil Russia Spain Mexico France Bolivia Poland Finland Norway Sweden Canada Belgium Uruguay Australia Portugal Paraguay Denmark Argentina Colombia Germany Netherlands New Zealand Europe Americas Business Enterprise Government Higher Education Private Non-Profit Non distributed Source: UIS S&T database 2006 Ocea.
GERD as a percentage of GDP, 2004 or latest available year 0.00 – 0.25 0.26 – 0.50 0.51 –1.00 1.01 – 2.00 2.01 and above Data not available Source: UIS S&T database 2006 and estimates
GERD as a percentage of GDP, 2004 or latest available year 0.00 – 0.25 0.26 – 0.50 0.51 – 1.00 1.01 and above Data not available Source: UIS S&T database 2006 and estimates
Gross Domestic Expenditure on R&D (GERD) in Asia, 2003 or latest available year Source: UIS S&T database 2006 *partial data
Gross Domestic Expenditure on R&D (GERD) in Asia, 2003 or latest available year (continued) Source: UIS S&T database 2006 *partial data
Gross Domestic Expenditure on R&D (GERD) in Africa, 2003 or latest available year *partial data Source: UIS S&T database 2006
Gross Domestic Expenditure on R&D (GERD) in Americas and Oceania, 2003 or latest available year Source: UIS S&T database 2006
Gross Domestic Expenditure on R&D (GERD) in Europe, 2003 or latest available year Source: UIS S&T database 2006
GERD as a percentage of GDP in 2000 by principal regions/sub-regions Developing countries spent around 0.9% of their GDP on R&D, still falling short of the target of 1% indicated in various S&T Policy documents Source: UIS estimates 2003 Note: Other Asia includes South Asia, South East Asia (excl. NIE), Arab states in Asia, Mongolia and Korea. Source: UIS estimates 2003
GERD as a percentage of GDP by region, 1990 - 2000 Source: UIS estimates 2004
GERD as a percentage of GDP in developing countries and in selected countries & regions in Asia and Africa, 1990 - 2000 Source: UIS estimates 2004
Shares of world R&D expenditure (GERD) by regions, 1990 - 2000 1990 1999/2000 Oceania, Oceania, Latin Africa, 1.3% Latin Africa, 0.8% 1.1% 1.0% America & America & Caribbean, Caribbean, 2.8% 2.8% Europe, Northern Northern Europe, 26.9% America, America, 33.9% 38.2% 37.2% Asia, 23.0% Asia, 31.2% Source: UIS estimates 2004
R&D expenditure (GERD) per researcher by principal regions /sub-regions, 2000 (in thousand PPP$) GERD per researcher in absolute terms as well as relative to GDP per capita suggest important issues to build up effective R&D systems in terms of salaries for researchers and proper working environment that provides access to research equipment, research facilities. Source: UIS estimates 2003 and A World of Science Vol. 2-1 UNESCO. Note: Other Asia includes South Asia, South East Asia (excl. NIE), Arab states in Asia, Mongolia and Korea.
GERD by sector of performance in Africa and Asia, 2003 or latest available year 100% 90% 80% 70% 60% 50% 40% 30% 20% 10% 0% India China Japan Sudan Kuwait Tunisia Uganda Malaysia Thailand Viet Nam Sri Lanka Indonesia Singapore Azerbaijan Asia Africa Africa Business Enterprise Government Higher Education Private Non-Profit Non distributed Philippines Seychelles Kyrgyzstan Kazakhstan South Africa Rep of Korea Source: UIS S&T database 2006
GERD by sector of performance in Americas, Europe and Oceania, 2003 or latest available year 90% 80% 70% 60% 50% 40% 30% 20% 10% 0% UK Chile USA Spain Brazil France Russia Poland Bolivia Mexico Canada Sweden Finland Norway Belgium Portugal Uruguay Denmark Paraguay Australia Germany Argentina Colombia Netherlands New Zealand Europe Americas Business Enterprise Government Higher Education Private Non-Profit Non distributed 100% Source: UIS S&T database 2006 Ocea.
GERD by source of funds in Africa and Asia, 2003 or latest available year 100% 90% 80% 70% 60% 50% 40% 30% 20% 10% 0% India China Japan Kuwait Tunisia Uganda Thailand Malaysia Viet Nam Sri Lanka Indonesia Singapore Azerbaijan Seychelles Kyrgyzstan Philippines Kazakhstan Mozambique South Africa Rep of Korea Source: UIS S&T database 2006 Asia Africa Business Enterprise Government Higher Education Private Non-Profit Non distributed Foreign
GERD by source of funds in Americas, Europe and Oceania, 2003 or latest available year 100% 90% 80% 70% 60% 50% 40% 30% 20% 10% 0% UK USA Chile Brazil Spain France Poland Bolivia Russia Norway Mexico Canada Finland Belgium Uruguay Sweden Paraguay Portugal Denmark Australia Colombia Germany Argentina Netherlands New Zealand Europe Americas Business Enterprise Government Higher Education Private Non-Profit Non distributed Foreign Source: UIS S&T database 2006 Ocea.
Why: Evidence-based policy-making • Evidence-based policy has been defined as an approach that “helps people make well informed decisions about policies, programmes and projects by putting the best available evidence from research at the heart of policy development and implementation” (Davies, 1999). • Further, evidence-based policy-making in a democratic context means that, wherever possible, public policy decisions should be reached after an open debate which is informed by careful and rigorous analysis using sound and transparent data. More specifically, it may be defined as the use of statistics to achieve issue recognition; inform programme design and policy choice; forecast the future; monitor policy implementation; evaluate policy impact (Scott, 2005).
Some key quotes • “Governments should promote the further development or setting up of national statistical services capable of providing sound data, disaggregated by gender and disadvantaged groups, on science education and R&D activities that are necessary for effective S&T policy-making. Developing countries should be assisted in this respect by the international community, using the technical expertise of UNESCO and other international organizations.”(Science Agenda - Framework for Action, World Science Conference, Budapest, 1999)
Targets and benchmarking • Government will make necessary budgetary commitments for higher education and science and technology. It will, through its own resources and also through contribution by industry, raise the level of investment to at least 2% of GDP on science and technology by the end of the Tenth Plan. (India, Science and Technology Policy 2003) • “The objective is to reach the objective set by the March 2002 Barcelona European Council, to increase the average research investment level from 1.9% of GDP today to 3% of GDP by 2010, of which 2/3 should be funded by the private sector.” (Investing in research: an action plan for Europe, Commission of the European Communities, 2003). • “To foster scientific and technological activity in all its aspects and widest possible scope to maintain a vigorous drive towards developing self reliance in scientific and technological capability, and to allocate a reasonable proportion of GNP for science and technology activity.” (Presidential Task Force Report, Science and Technology Policy for the 1990s, Sri Lanka)
Targets and benchmarking (contd.) • “To demonstrate their political will and commitment to improving the tot of these peoples, Member States are urged, within the coming decade, to aim at gradually reaching the target of mobilising, at the domestic level, 1 per cent of their GDP for the development of their scientific and technological capabilities.” (Lagos plan of action for the economic development of Africa, Organization of African Unity, 1980) • “An example is the target of a ratio of R&D spending to GDP of 1% for African countries.” (Africa’s Science and Technology Consolidated Plan of Action, AMCOST/NEPAD, 2005). • South Africa has set a goal of achieving R&D expenditure equivalent to 1% of GDP by the year 2008 (http://www.dst.gov.za/).
Millennium Project • The international mobility of skilled people is one of the key mechanisms for the transition of technological capability across countries. To use this mechanism effectively, countries need to design institutions that enable them to use the skills of their nationals wherever they live. Such institutional arrangements need to rely on a commitment to international cooperation and partnerships. • Marginalized in the development process, these universities seek only to churn out graduates. Universities need to be re-envisioned as potentially powerful partners in the development process. • The science, technology, and innovation curricula in many developing country universities are outdated or lack a cross-disciplinary approach. In certain departments, the research emphasis needs to be shifted toward issues of local and national relevance. • Creating links between knowledge generation and enterprise development is one of the most important challenges developing countries face. A range of structures can be used to create and sustain enterprises, from taxation regimes and market-based instruments to consumption policies and changes within the national system of innovation
UIS view of S&T statistics • Human resources • Innovation; especially at local level, including organizational change • Three stage strategy • R&D > innovation > impact
Definition • Science and technology indicators may be defined as a series of data designed to answer questions about the existing state of and/or changes in the science and technology enterprise, its internal structure, its relationships with the outside world, and the degree to which it is meeting the goals set it by those within or without (Fabian, 1979). • The aim of science and technology indicators is similar to that of social indicators: to obtain a picture of the state of science and technology and anticipate the consequences of scientific advances and technological change (Sirilli, 1998).
What: Types of S&T indicators Inputs “Black box”Outputs Science and Technology • We cannot measure S&T directly. Therefore we measure proxies: • Input indicators • Output indicators • Impact indicators Human Resources Publications Expenditure Patents
What is in the “black box”? • We need to define clearly WHAT we are measuring. • Science and Technology? • Innovation? • Research and Experimental Development (R&D)?
WHAT DO WE MEASURE: Types of indicators • Input indicators: R&D expenditure and human resources. • Output indicators: publications and patents. • Impact indicators: innovation, social impact (?). • Technology transfer indicators: technology balance of payment.
Chris Freeman’s pyramid revisited YOU ARE HERE Standards Consensus
UNESCO methodologies and frameworks • Recommendation concerning the International Standardization of Statistics on Science and Technology, 1978 • UNESCO Manual for Statistics on Scientific and Technological Activities ST-84/WS/12, Paris, 1984 • International Standard Classification of Education - ISCED 1997
“Frascati family” of OECD Manuals The Measurement of Scientific and Technological Activities
STA: Definition For statistical purposes, Scientific and Technological Activities (STA) can be defined as all systematic activities which are closely concerned with the generation, advancement, dissemination, and application of scientific and technical knowledge in all fields of science and technology, that is the natural sciences, engineering and technology, the medical and the agricultural sciences (NS), as well as the social sciences and humanities (SSH).
R&D: Definition Research and experimental development (R&D) comprise creative work undertaken on a systematic basis in order to increase the stock of knowledge, including knowledge of man, culture and society, and the use of this stock of knowledge to devise new applications.
STET: Definition Scientific and technological education and training at broadly the third level (STET)can be defined as all activities comprising specialized non-university higher education and training, higher education and training leading to a university degree, post-graduate and further training and organized lifelong training for scientists and engineers.
STS: Definition Scientific and technological services (STS)can be defined as any activities concerned with scientific research and experimental development and contributing to the generation, dissemination and application of scientific and technical knowledge.
STS: detailed activities • S&T services provided by libraries, archives, information and documentation centres, reference departments, scientific congress centres, data banks and information-processing departments. • S&T services provided by museums of science or technology, botanical and zoological gardens and other S&T collections (anthropological, archaeological, geological, etc.). • Systematic work on the translation and editing of S&T books and periodicals. • Topographical, geological and hydrological surveying; meteorological and seismological observations; surveying of soils and of plants; fish and wildlife resources; routine soil, atmosphere and water testing; the routine checking and monitoring of radioactivity levels. • Prospecting and related activities designed to locate and identify oil and mineral resources.
STS: detailed activities (continued) • The gathering of information on human, social, economic and cultural phenomena, usually for the purpose of compiling routine statistics, e.g. population censuses; production, distribution and consumption statistics; market studies; social and cultural statistics, etc. • Testing, standardization, metrology and quality control; regular routine work relating to the analysis, checking and testing, by recognized methods, of materials, products, devices and processes, together with the setting up and maintenance of standards and standards of measurement. • Regular routine work on the counselling of clients, other sections of an organization or independent users, designed to help them to make use of scientific, technological and management information. • Activities relating to patents and licences.
Innovation: definition (Oslo Manual 2005) Aninnovationis the implementation of a new or significantly improved product (good or service), or process, a new marketing method, or a new organisational method in business practices, workplace organisation or external relations.