1 / 0

Outline of Randomization Lectures

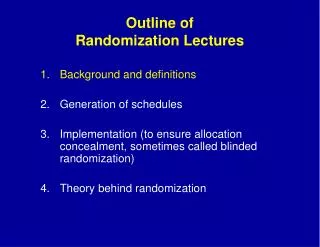
Outline of Randomization Lectures. Background and definitions Generation of schedules 3. Implementation (to ensure allocation concealment, sometimes called blinded randomization) 4. Theory behind randomization.

feng
Download Presentation

Outline of Randomization Lectures

An Image/Link below is provided (as is) to download presentation Download Policy: Content on the Website is provided to you AS IS for your information and personal use and may not be sold / licensed / shared on other websites without getting consent from its author. Content is provided to you AS IS for your information and personal use only. Download presentation by click this link. While downloading, if for some reason you are not able to download a presentation, the publisher may have deleted the file from their server. During download, if you can't get a presentation, the file might be deleted by the publisher.

E N D

Presentation Transcript


  1. Outline ofRandomization Lectures Background and definitions Generation of schedules 3. Implementation (to ensure allocation concealment, sometimes called blinded randomization) 4. Theory behind randomization
  2. A list showing the order in which subjects are to be assigned to the various treatment groups Randomization Schedule
  3. Implementation Schemes 1. Sealed envelopes - Opaque - Sequentially numbered 2. Telephone - Answering service - Coordinating center - IVRS 3. Personal computers - Local - Through communication with coordinating center International coordinating centers in HIV treatment trials use web-based system Through electronic medical record for “point-of-care” or “clinically integrated” randomized trials.
  4. Urokinase-Pulmonary Embolism Trial (UPET)Circulation, 1973 1. Telephone answering service in New York City; 24-hour coverage 2. Assignments obtained through hospital pharmacy 3. Sealed envelopes as back-up
  5. Multiple Risk Factor Intervention Trial (MRFIT)JAMA, 1982 1. Assignments obtained by calling coordinating center after: a. Three screening visits b. Informed consent c. Eligibility checklist 2. Sealed envelopes used as back-up
  6. Treatment of MildHypertension Study (TOHMS) 1. Assignment (bottle no.) obtained using personal computer to call coordinating center computer after: a. Three screening visits b. Informed consent c. Eligibility checklist 2. Call coordinating center for back-up 3. Unique bottle no. for each participant 4. Bottle no. not assigned in sequence Amer J Cardiol, 1987
  7. Community Programs for Clinical Research on AIDS (CPCRA) 1. Assignments obtained by calling Statistical Center: – Minimal data collection – Usually no data at Statistical Center prior to randomization – Eligibility checklist reviewed on telephone call 2. Pharmacist telephones to confirm assignment 3. Unique study ID number (SID) for each patient 4. SID numbers not assigned in sequence
  8. Components of CPCRA Randomization System 1. Randomization schedule, based on randomly permuted blocks 2. SID numbers, sheets, and notebooks 3. Randomization logbooks 4. Eligibility checking program 5. Pharmacy checking program 6. Backup procedures 7. Training (local and for clinical sites)
  9. Controlled Onset Verapamil Investigation of Cardiovascular Endpoints (CONVINCE) Interactive Voice Response System (IVRS) Touch-tone keypad used for data entry of key eligibility data System verifies eligibility and assigns medication code (bottle number) Caller re-enters medication code as a double-check System also used for medication refills
  10. IVIG Trial Randomization
  11. Procedure summarizes data entered & asks you to re-enter weight
  12. If randomization is successful, 3 documents are available to save and print
  13. Treatment Prescription Double-check dose against your calculation on the Baseline CRF, and complete bottom portion
  14. Timing of RandomizationUsual Sequence of Events 1. Verify eligibility, informed consent, and completeness of baseline data. 2. Obtain assignment. 3. Record assignment on log and case report forms. 4. Initiate treatment as soon as possible after randomization.
  15. Alprenolol vs. Placebo in Post-MI Placebo Alprenolol No. randomized 193 200 2 weeks No. given treatment 69 93 Excluded: 124 107 Disease history 84 74 Rx contraindication 11 10 Dead 17 18 Other 12 5 Ahlmark, Eur J Pharmac, Vol. 10, 1976
  16. No Response No Response Response Response Chlorambucil Chlorambucil BCVP BCVP Induction and Maintenance Treatment for Non-Hodgkin’s Lymphoma Non-Hodgkin’s Lymphoma Trial Cytoxan-Prednisone BCNU-Prednisone See Pocock, Clinical Trials: A Practical Approach, Page 72.
  17. Adjuvant Chemotherapy for Breast Cancer (A) (B) 1 year of chemotherapy OR 2 yearsof chemotherapy Continue1 moreyear 1 yearof chemotherapy Stop Rivkin N, et al. J Clin Oncology, 11:1710-1716;1993.
  18. Recommendations Make assignments close to the onset of treatment from a central source after checking eligibility Implement the randomization with a method that ensures allocation concealment Never deviate from the schedule Verify assignments
  19. Examples of Problems with Allocations Concealment Hypertension Detection and Follow-up Program (HDFP) – a single site (envelopes that were opened in advance) Heparin for acute MI (N Engl J Med 1960) – (envelopes not opaque or consecutively numbered) Captopril for hypertension (Lancet 1999) (large baseline differences indicating envelopes opened in advance)
  20. Documentation and Reporting of Randomization Methods Document methods for generating schedules, but do not share details with the investigators Describe allocation ratio and stratification variables in the protocol Report how randomization was done in the trial report
  21. Example: Strategies for Management of AntiRetroviral Therapy (SMART) Study Protocol: “Eligible patients will be randomized in a 1:1 ratio to either the DC or VS group. Randomization will be stratified by clinical site. Randomization schedules will be constructed to ensure that approximately equal numbers of patients are assigned each treatment within clinical site.” Trial Report (N Engl J Med 2006; 355:2283-96): “Randomization was stratified by clinical site with the use of permuted blocks of random sizes.”
  22. Reporting Example That Includes Method of Implementation: HIV Trial in South Africa (Phidisa II) Trial Report (JID 2010; 202:1529-1537): “Randomization was stratified by site, using randomly mixed permuted blocks of different sizes. Assignments were obtained by calling a central toll-free number”
  23. Outline ofRandomization Lectures Background and definitions Generation of schedules 3.Implementation (to ensure allocation concealment, sometimes called blinded randomization) 4. Theory behind randomization
  24. Advantages of Randomization Bradford Hill: 1. Eliminates bias from treatment assignment 2. Balances known and unknown differences between groups on average 3. More credible study RA Fisher: 1. Assures validity of statistical tests (type 1 error)
  25. Fisher and the Validity of Statistical Tests (1) Randomization guarantees that statistical tests will have the valid significance levels. Even though groups may not be exactly balanced with respect to covariates, randomization permits a probability distribution to be determined for comparing treatments for outcomes of interest
  26. Fisher and the Validity of Statistical Tests (2) Randomization provides a basis for an assumption free statistical test of the equality of treatments – need to analyze your data taking into account the way the randomization schedule was prepared. Such tests are referred to as randomization tests or permutation tests
  27. Test of Significance at the End of a Trial Statistically Significant? Yes No Reject null hypothesis (HO) Do not reject HO Sampling variationis an unlikelyexplanation for thediscrepancy Sampling variationis a likelyexplanation for thediscrepancy
  28. Relationship of Study Sample to Study Population and Population at Large Population at Large Definition ofCondition Population withoutCondition Population with Condition Entry Criteria With Conditionbut Ineligible Study Population Eligible butnot Enrolled Enrollment Study Sample Source: Chapter 4, Friedman, Furberg and DeMets.
  29. Population Model as aBasis for Statistical Testing Population A y ~ G(y | A) Random Sample nA patients yAj ~ G(y | A) Population B y ~ G(y | B) Random Sample nB patients yBj ~ G(y | B)
  30. Example G is normal, i ~ N(i , 2) Student’s t-test is most powerful test for testing Ho : A = B
  31. NA patients NB patients Invoked Population Model – Randomization Model Nonrandom Selection of Clinics in a Nonrandom Selection of Communities Undefined Sampling Procedure for Patients(a variety of sources are used) N = NA + NB patients Randomization Source: Lachin J. Cont Clin Trials, 1988.
  32. Randomization Model Assumptions Under HO responses are assumed to be fixed (non-random) values – each patient’s response is what it would have been regardless of treatment A or B The observed difference between A and B only depends on the way treatments were assigned (independent of other patient characteristics) To assess whether observed difference is “unusual”, consider all possible ways patients could have been assigned A or B (permutation test) Under simple randomization, permutation test is asymptotically equal to homogenous population model.
  33. Randomization or Permutation Test 1. Calculate test statistic for sample data, e.g., A - B difference, t-statistic 2. Determine the number of possible randomization sequences 3. Enumerate all of these permutations; calculate the test statistic for each and their cumulative distribution 4. Determine where the test-statistic for sample lies on distribution of all possible values
  34. Example 3: Eight experimental units are randomly allocated to receive treatment A or B Treatment Group A B 18 9 13 16 3 17 17 17 n 4 4 mean 12.75 14.75 (sd)2 46.92 14.92 pooled (sd)2 30.92
  35. 1 4 1 4 + t-statistic with 6 degrees of freedom 12.75 - 14.75 t(6) = = -0.51, p = 0.628   30.92
  36. The number of permutations using simple random allocation (1:1) of NA and NB assignments is given by: ( ) NA + NB NA = (NA + NB)!/ NA ! NB! NA = NB = 4 and number of permutations =70
  37. Cumulative Distribution of t-statistic Obtained from Randomization and Students’ Distribution Cumulative Distribution t Randomization Students’ t(6) -2.48 1/70 .014 .024 -2.15 4/70 .057 .038 -1.88 5/70 .071 .055 -1.45 8/70 .114 .097 -1.26 12/70 .171 .127 -1.09 15/70 .214 .159 -.78 18/70 .257 .233 -.64 22/70 .314 .273 -.51* 25/70 .357* .314* -.25 28/70 .400 .405 -.125 32/70 .457 .452 0.0 38/70 .543 .500 .125 42/70 .600 .548 .25 45/70 .643 .595 .51 48/70 .686 .686 .64 52/70 .743 .727 .78 55/70 .786 .767 1.09 58/70 .828 .841 1.26 62/70 .886 .873 1.45 65/70 .928 .901 1.88 66/70 .943 .945 2.15 69/70 .986 .962 2.48 70/70 1.000 .976 * * sample value, 2-sided p-value 50/70 = 0.71 versus 0.63
  38. Impact on P-value of Ignoring Blocking in the Analysis Simple Randomization of 20 Patients Outcome (Alive/Dead) Treatment Accession No. 1 A A 2 B D 3 A D 4 B D 5 B D 6 B D 7 A D 8 A A 9 B D 10 B D 11 A A 12 A A 13 B D 14 A A 15 A A 16 B D 17 A A 18 B A 19 B A 20 A A Dead Alive A 2 2 8 B Fisher’s exact test p-value = 0.0115 (1-tailed)
  39. Dead Alive A 8 2 B 2 8 Alive Dead A 9 1 B 1 9 Dead Alive A 10 0 B 0 10 P-value = Probability 2 or fewer of the 10 deaths were randomly allocated to A or or
  40. P - value = æ ö æ ö æ ö æ ö æ ö æ ö 10 10 10 10 10 10 ç ÷ ç ÷ ç ÷ ç ÷ ç ÷ ç ÷ 2 8 1 9 0 10 è ø è ø è ø è ø è ø è ø + + æ ö æ ö æ ö 20 20 20 ç ÷ ç ÷ ç ÷ è 10 ø è 10 ø è 10 ø = . 01096 + . 00054125 + . 00000541 = 0 . 0115 Fisher’s Exact Test
  41. Restricted Randomization (block size = 4) Outcome (Alive/Dead) Accession No. Treatment 1 A A 2 B D 3 A D 4 B D 5 B D 6 B D 7 A D 8 A A 9 B D 10 B D 11 A A 12 A A 13 B D 14 A A 15 A A 16 B D 17 A A 18 B A 19 B A 20 A A
  42.           p-value = = 0.0069 1 2 1 2 1 6 1 6 1 Probability Alive Dead A 1 1 Block 1 1 2 B 0 2 Dead Alive A 1 1 Block 2 1 2 B 0 2 Dead Alive A 2 0 Block 3 1 6 B 0 2 Alive Dead A 2 0 Block 4 1 6 B 0 2 Alive Dead A 2 0 Block 5 1 B 2 0
  43. - æ ö æ ö R N R ç ÷ ç ÷ - r n r è ø è ø = Prob (r alive on A) æ ö N ç ÷ n è ø General Setup Alive Dead A n r n - r (N - R) – (n - r) B R - r N - n R N - R N Based on hypergeometric distribution.
  44. Randomization Theory Summary Guarantees control of type I error in hypothesis tests Permutation or randomization tests are motivated by the random assignment of patients The more restrictions imposed on the randomization, the harder it is to determine the permutation distribution. Permutation tests are not routinely used in the analysis of trials (conservative). Can be useful to consider blocking if population is heterogeneous over time.
More Related