Download
1 / 19
190 likes | 353 Views
Chapter 3. National Income: Where it Comes From, Where it Goes. Homework: p. 78-79 #1, 4a c, d; 10 macromodel : equilibrium_interest_rate 1, 3, 7 Won’t be responsible for the appendix. Link to syllabus. Fig. 3-1 p. 48. Circular Flow.

E N D
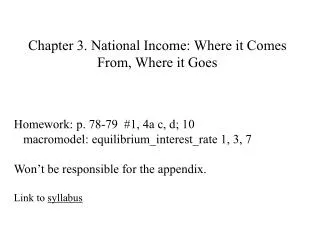
Chapter 3. National Income: Where it Comes From, Where it Goes Homework: p. 78-79 #1, 4a c, d; 10 macromodel: equilibrium_interest_rate 1, 3, 7 Won’t be responsible for the appendix. Link to syllabus
Fig. 3-2 p. 54.The determination of the earnings of a factor of production.
Figure 3-5 p. 61. The ratio of labor income to total income In earlier edition, was in Appendix as Fig. 3-13 p. 73
Table 3-1 p. 63. Growth in Labor Productivity and Real Wages in the US Point is that these two move together, implying that productivity is the major determinant of wage income
Different text The prime interest rate and the Federal funds rate Parallels the textbook’s discussion on page 67. Link to data from the Minneapolis Fed
Fig. 3-8 p. 71. Savings, Investment, and the Real Interest Rate
Fig. 3-10 p. 73. Military Spending and Interest Rates in the U.K.
Fig. 3-11 p. 75. An Increase in Investment Demand: Fixed Savings
Fig. 3-12 p. 76 Increase in Investment Demand with Savings Responding to Interest Rates
Homework Problems P. 76 #1.In neoclassical model, how do these affect real wage and rental price of capital? a). Wave of immigrants. b. Earthquake destroys capital. C. Tech change #3. Changes in incomes of farmers and barbers (unskilled manual work): If Farmers have productivity gains, and barbers do not #9. If consumption (and therefore saving) depend on interest rate, how does that affect analysis of fiscal policy.