Download
1 / 57
590 likes | 816 Views
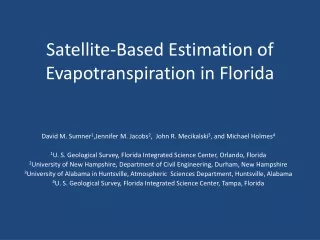
Satellite-Based Estimation of Evapotranspiration in Florida. David M. Sumner 1 ,Jennifer M. Jacobs 2 , John R. Mecikalski 3 , and Michael Holmes 4 1 U. S. Geological Survey, Florida Integrated Science Center, Orlando, Florida

E N D
Satellite-Based Estimation of Evapotranspiration in Florida David M. Sumner1,Jennifer M. Jacobs2, John R. Mecikalski3, and Michael Holmes4 1U. S. Geological Survey, Florida Integrated Science Center, Orlando, Florida 2University of New Hampshire, Department of Civil Engineering, Durham, New Hampshire 3University of Alabama in Huntsville, Atmospheric Sciences Department, Huntsville, Alabama 4U. S. Geological Survey, Florida Integrated Science Center, Tampa, Florida
Varieties of ET • Actual ET • Reference ET - hypothetical surface ET • Potential ET - ET when moisture is not limiting - surface-dependent
Problem & Need • Potential ET is common input for hydrologic models (surface dependent) • Reference ET is needed for allocation of water (for real or hypothetical “reference” surface) • PET and RET are inconsistently determined among the five Florida Water Management Districts • Areally-continuous coverage of both PET and RET is lacking
Potential ET = ET without water limitation • Actual ET = parameterized function of: • PET, water level, soil moisture, and/or LAI • MODFLOW, MikeShe, HSPF, VS2D, etc. MODFLOW ET conceptualization
Reference ET w/crop coefficients • Reference ET computed using: - - weather station data - - selected RET equation (varieties of Penman-Monteith, Blaney-Criddle, Hargreaves, etc.) and crop coefficent specific to crop type and phase is applied as multiplier AET = kcRET
Jan Feb Mar Apr May Jun Jul Aug Sep Oct Nov Dec Original BC Shih Modified BC Crop Coefficients
Problem & Need • Potential ET is common input for hydrologic models (surface dependent) • Reference ET is needed for allocation of water (for real or hypothetical “reference” surface) • PET and RET are inconsistently determined among five Florida Water Management Districts • Areally-continuous coverage of both PET and RET is lacking
Objectives Estimate reference and potential ET - - throughout State of Florida - - 1995 to 2004 … and beyond - - at 2 km spatial resolution - - at daily temporal resolution - - with spatial grid consistent with NEXRAD grid
RET computations Calculation of RET was performed using: • ASCE 2000 reference ET method • (daily version of Penman-Monteith w/grass standard) • Required input = incoming solar radiation • air temperature • relative humidity • wind speed
Meteorological data Inverse distance weighting interpolation of numerous NOAA, UF, and WMD weather station data to 2-km grid. UF and WMD NOAA
PET models considered • Simple method • Priestley-Taylor • Penman-Monteith
Comparison of PET models with AET measured during low Bowen ratio conditions ….. Supports choice of Priestley-Taylor PET
D lE = a (Rn – G) D + g PET computations (daily) Calculation of PET was performed with the Priestley-Taylor method Solar radiation measured via satellite … … other variables estimated using spatial interpolation of land-based station data. Required input = net radiation (Rn) a = 1.26 D = f(air temperature) G is assumed zero over a day
Net Radiation Net radiation = Rs – aRs +Ld - Lu Longwave up (Lu) Longwave down (Ld) Incoming solar (Rs) Reflected solar = aRs 4-component radiation sensors (11) used to define means to estimate reflected solar and longwave terms
Longwave radiation simulation • Stefan-Boltzmann equation • Radiation = esT4 • surface ~ 0.97 for soil/grass/snow • atmosphere= • f (vapor, temperature, cloudiness) • Clear sky eclear (e) – Sellers (1965) • Cloudy sky e (eclear ,Rs/Ro) - Crawford and Duchon (1999)
Longwave radiation simulation • Stefan-Boltzmann equation • Radiation = esT4 • surface ~ 0.97 for soil/grass/snow • atmosphere= • f (vapor, temperature, cloudiness) • Clear sky eclear (e) – Sellers (1965) • Cloudy sky e (eclear ,Rs/Ro) - Crawford and Duchon (1999)
Incoming solar radiation has strong explanatory value (> 80%) for temporal variability of PET and RET in Florida Incoming solar radiation (MJ/m2/d) Reference or potentialET (mm/d) 1995 1996 1997 1998 1999 2000 2001 2002 2003 2004
Longwave terms are large … but solar terms exhibit most variability Radiation, in W/m2 Day of year 2008
Solar radiation terms explain most (~ 84% at central Florida station) of temporal variability in net radiation Radiation, in W/m2 Day of year 2008
Solar radiation is strongly affected by cloud cover … and Florida is relatively cloudy. Frequency (%) of clear sky conditions From: Climatic Atlas of Clouds over Land and Ocean by Warren and Hahn (2007)
Large spatial variability in cloud cover ---> Large spatial variability in incoming solar radiation and ET
GOES East 8 and 12 geostationary satellites provide spatially (1-km in Florida) and temporally (30 minute) data,capturing spatial and diurnal changes in cloud cover and solar radiationPolar-orbiting satellites (MODIS, AVHRR, Landsat) provide less frequent monitoring. • Gautier-Diak-Masse model – simple radiative transfer model incorporating: • Clouds • 2. water vapor absorption • 3. Raleigh/Mie scattering • 4. ozone absorption • Gautier et al. (1980) • Diak and Gautier (1983) • Diak et al. (1996)
Approach • 2-week minimim noon albedo • Is pixel cloudy? • If so, solve for cloud albedo. • Solve for incident solar radiation (full SW bandwidth)
GOES albedo = solar albedo GOES “visible” bandpass Albedo
GDM model has shown regional utility Otkin et al. (2005) : Method has error on the order of ~7-8% during clear-sky conditions, and ~17% during cloudy-sky conditions. AMS Agriculture and Forest Meteorology Conf. Orlando, Florida 30 April 2008
Calibration of GDM incoming solar radiation product for Florida • Clear-sky conditions • Cloudiness bias correction • Temporal bias correction
Clear-Day Comparison Initial Model Calibration Uncorrected
Clear-Day Comparison Initial Model Calibration Corrected +4%
Calibration of GOES daily solar product under cloudy conditions 19 pyranometer stations ~ 36,000 station-days over 1995-2004
GOES daily solar bias related to cloudiness Mean solar radiation ~ 190 w/m^2 … winter solstice ~ 100 w/m^2 … summer solstice ~ 270 w/m^2
Measured vs. GOES insolation Orange = south Blue = north
Error statistics of 9 “validation” stations during calibration path Initial Clear-sky Cloudiness Temporal trend
Examples of incoming solar radiation daily product Summer Winter