Introducing Statistical Inference using Randomization Methods
Introducing Statistical Inference using Randomization Methods. Todd Swanson & Jill VanderStoep Hope College Holland, Michigan. What is the Randomization Approach?.

Introducing Statistical Inference using Randomization Methods
E N D
Presentation Transcript
Introducing Statistical Inference using Randomization Methods Todd Swanson & Jill VanderStoep Hope College Holland, Michigan
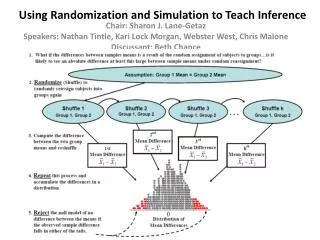
What is the Randomization Approach? • In traditional tests, a theoretical distribution is used to determine how unlikely it would be for an observed statistic to occur under a true null hypothesis. • In randomization tests, we don’t use a theoretical distribution, but use simulation to develop a distribution. • We simulate the study under a true null hypothesis. • After the simulation, we calculate the statistic of interest. • We repeat this many times to develop a distribution that models the null.
History • Spring of 2009 • We began writing a curriculum for introductory statistics in which inference was introduced through randomization methods. • Fall of 2009 • The new curriculum was first used in all introductory statistics sections at Hope College. • Spring 2010 and each semester since • Revision of curriculum
Changes in Pedagogy • Topics are introduced through a brief lecture • Students work on activities to learn and reinforce the topics. • Tactile learning (shuffling cards and flipping coins) to estimate p-values • Computer based simulations (applets) • Collecting data and running experiments
Changes in Data --- Real Research • We try to avoidcute, but impractical illustrations of statistics. We include real data and real research that matters. • Homework problems and case studies also involve real statistical data and research. • Each chapter contains a research paper that students read and respond to questions.
Examples we currently use • Can dogs sniff out cancer? • Is there an advantage to wearing a certain color of uniform in Olympic combat sports? • Does swimming with dolphins ease depression symptoms? • Can babies tell the difference between naughty and nice? • Does the perceived price of a drug influence its perceived effect? • Can students study better when listening to music with lyrics or without lyrics?
Student Projects • Students complete two in-depth projects • Mid-semester they analyze a large data set that is provided and give a short presentation in class on their findings. • At the end of the semester the students design a study, do a literature review, collect data, and present their results in class. They also write their results up as a research paper.
1. Ask a research question Research Conjecture 2. Design a study 3. Collect data 4. Explore the data - Significance - Estimation Logic of Inference 5. Draw inferences beyond the data - Generalize - Cause/Effect Scope of Inference 6. Formulate conclusions 7. Communicate findings Seven Step Method
Example: Day One • Can dolphins communicate abstract ideas? • In an experiment done in the 1960s, Doris was instructed which of two buttons to push. She then had to communicate this to Buzz (who could not see Doris). If both he and Doris picked the correct buttons, both dolphins would get a reward. • In one set of trials, Buzz chose the correct button 15 out of 16 times. • Based on these results, do you think Buzz knew which button to push or was he just guessing? • How might we justify an answer? • How might we model this situation?
Example: Day One • The students, with a little prompting, will quickly come up with the idea of flipping a coin 16 times, count the number of times heads, and repeat this process many times. • The students flip coins and pool their results. • We then use a computer applet to quickly simulate many repetitions of coin flips.
Original Content • For the first two years we divided the course into two parts. • The first half of course was based on randomization methods and second half was based on traditional methods.
Original ContentUnit 1: Randomization Methods • Chapter 1: Introduction to Statistical Inference: One proportion • Coin flips and applets are used to model null • Chapter 2: Comparing Two Proportions • Permutation tests are introduced using playing cards and Fathom • Chapter 3: Comparing Two Means • Continued use of permutation tests with cards and Fathom. • Chapter 4: Correlation and Regression
Original ContentUnit 2: Traditional Methods • Chapter 5: Correlation and Regression • Confidence Intervals Introduced • Power (strength of evidence) as it relates to sample size, significance level, and population correlation • Chapter 6: Comparing Means • Two-sample t-test and ANOVA • Chapter 7: Comparing Proportions • Using normal distribution and chi-square • Chapter 8: Tests of a Single Mean and Proportion • Also included chi-square goodness of fit
Things We Liked about our Curriculum • Students gained a deeper understanding of inference. • Results from CAOS tests were compared to those done with our traditional course. • We were able to put more real research into our curriculum • Case studies, research articles, homework, examples. • A mid-semester project could focus on inference instead of focusing on descriptive statistics. • By mid-semester we were in some ways in a similar place as we used to be at the end of the semester.
Things That Needed Improvement • We had a little trouble getting through all the material. • We used a lot more activities and less lecture. • Understanding confidence intervals needed improvement. • Confidence intervals were not introduced until the second half of the course. • In the end, some ideas behind the randomization methods were forgotten. • For technology we used applets, Fathom, and SPSS.
Updated Content • Chapter 1: Introduction to the Statistical Investigative Process • One proportion test using randomization methods focusing on process probabilities. • Chapter 2: Random Samples and Variability • Still focusing on a single proportion. • Sampling from populations, Normal-based method, Confidence Intervals • Chapter 3: Comparing Two Proportions • Permutation tests and traditional tests and confidence intervals. • Experiments introduced.
Updated Content • Chapter 4: Correlation and Regression • Scatterplots, Correlation, and Regression • Permutation and traditional test for correlation. • Chapter 5: Comparing Means • Two-sample tests, paired data, single mean. • Permutation tests and traditional methods • Confidence intervals • Chapter 6: Comparing Multiple Group Means and Proportions • Permutation Test for multiple means and ANOVA • Chi-square test for association and goodness-of-fit
Things that went well • Students easily used randomization methods for their final project when conditions weren’t met to perform traditional tests • Better understanding of confidence intervals and how they related to tests of significance
Things that need improvement • Interpretation of confidence intervals. • We still have a lot of examples that use data collected from Hope College students. • Led to some non-creative student projects that used surveys of Hope students about college things: GPA, Greek life, GPA, caffeine consumption, etc. • We want students to think more broadly.
Another Major Update • We are in the midst of another major update in which we basically follow the same order as we did this past fall. • We are spending more time at the beginning laying out the ground work. • More emphasis on scope of conclusions. • More examples from real research. • More use of applets for randomization as well as traditional tests.
A Work in Progress • We will continue to revise our materials this year. • Besides the two of us working on this project, we also have: • Nathan Tintle, Dordt College • Beth Chance, CalPoly • Allan Rossman, CalPoly • Soma Roy, CalPoly • George Cobb, Mt Holyoke
Thanks! • More information can be found at www.math.hope.edu/isi • Email • Todd: swansont@hope.edu • Jill: vanderstoepj@hope.edu