Download
1 / 1
10 likes | 186 Views
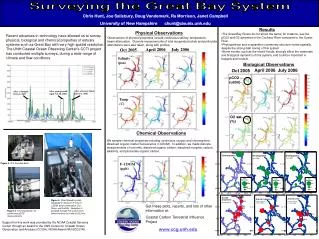
Surveying the Great Bay System. Chris Hunt, Joe Salisbury, Doug Vandemark, Ru Morrison, Janet Campbell University of New Hampshire chunt@cisunix.unh.edu. Results

E N D
Surveying the Great Bay System Chris Hunt, Joe Salisbury, Doug Vandemark, Ru Morrison, Janet Campbell University of New Hampshire chunt@cisunix.unh.edu • Results • The Great Bay Rivers do not all act the same; for instance, see the pCO2 and O2 dynamics in the Cocheco River compared to the Oyster River • Phytoplankton and zooplankton community structure varies spatially, despite the strong tidal mixing of this system • Storm events, such as the recent floods, strongly affect the carbonate and biological dynamics of this system, and could be important in budgets and models Physical Observations Recent advances in technology have allowed us to survey physical, biological and chemical properties of estuary systems such as Great Bay with very high spatial resolution. The UNH Coastal Ocean Observing Center’s CCTI project has conducted multiple surveys, during a wide range of climate and flow conditions. Observations of physical properties include continuous salinity, temperature, beam attenuation. Discrete measurements of total suspended solids and particulate absorbance were also taken, along with profiles. April 2006 July 2006 Oct 2005 Salinity (psu) Biological Observations April 2006 July 2006 Oct 2005 pCO2 (uatm) After a historic flood: June 5-6, 2006 After spring runoff: April 7 & 10, 2006 After a drought: Oct 4-6, 2005 Temp (C) O2 sat (%) Chemical Observations We sample chemical properties including continuous oxygen and chromophoric dissolved organic matter fluorescence (f-CDOM). In addition, we made discrete measurements of nutrients, dissolved organic carbon, dissolved inorganic carbon, alkalinity, and particulate organic carbon. F-CDOM (ppb) Figure 2. R/V Camden Belle Figure 4.Flow-through system equipped to measure Fl-Chl, Fl-CDOM, beam attenuation, DO, Temp, and Salinity. Seawater is pumped through the system from below the boat at a rate of 20L/min. Get these plots, reports, and lots of other information at: Coastal Carbon Terrestrial Influence Project www.ccg.unh.edu Figure 3. Fast equilibrator for continuous pCO2 measurements. Support for this work was provided by the NOAA Coastal Services Center through an award to the UNH Center for Coastal Ocean Observation and Analysis (COOA), NOAA Award NA16OC2740.