Download
1 / 61
630 likes | 808 Views
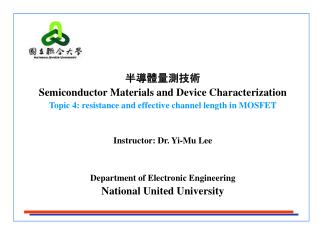
EE5342 – Semiconductor Device Modeling and Characterization Lecture 27 April 26, 2010. Professor Ronald L. Carter ronc@uta.edu http://www.uta.edu/ronc/. Gummel-Poon Static npn Circuit Model. Intrinsic Transistor. C. R C. I BR. B. R BB. I LC. I CC - I EC = {IS/Q B }*

E N D
EE5342 – Semiconductor Device Modeling and CharacterizationLecture 27April 26, 2010 Professor Ronald L. Carter ronc@uta.edu http://www.uta.edu/ronc/
Gummel-Poon Staticnpn Circuit Model Intrinsic Transistor C RC IBR B RBB ILC ICC -IEC = {IS/QB}* {exp(vBE/NFVt)-exp(vBC/NRVt)} IBF B’ ILE RE E
IBF = IS expf(vBE/NFVt)/BF ILE = ISE expf(vBE/NEVt) IBR = IS expf(vBC/NRVt)/BR ILC = ISC expf(vBC/NCVt) ICC -IEC = IS(exp(vBE/NFVt - exp(vBC/NRVt)/QB QB = (1 + vBC/VAF + vBE/VAR ) {½ + [¼ + (BFIBF/IKF + BRIBR/IKR)]1/2} Gummel Poon npnModel Equations
Introduction • Self heating of the transistor is proportional to the power dissipated. • Temperature Rise = ΔT = Rth ∙Power • The VBIC model was developed to simulate the BJT such that the device temperature tracked power dissipation in real time. • Other circuit simulators which accommodate thermal resistance are • HICUM • MEXTRAM
Rth Estimation for a Small Diode-isolated BJT Device VBE=0.87 V and VCE=20 V, RTH = 341 C/W
VBIC Model Highlights Self-heating effects included Improved Early effect modeling Quasi-saturation modeling Parasitic substrate transistor modeling Parasitic fixed (oxide) capacitance modeling An avalanche multiplication model included Base current is decoupled from collector current dt tl
CAD Tools Support for VBIC • Hspice [4] • Does not support PNP device • Does not scale with “Area” and “M” terms • Spectre [5] • Support both NPN and PNP devices • scale with “Area” and “M” term • HPADS • No temperature nodes (“dt” and “tl”), so unable to simulate thermal coupling effects
Parameters Description Spectre [4] Hspice [5] Name Default Name Default Temperature rise of the device from ambient trise 0 dtemp 0 Ambient temp. temp 27 temp 25 Parameters measurement temperature tnom 27 tnom 25 tref 27 Temperature Designations for VBIC
Using VBIC in Spectre[5] Name c b e [s] [dt] [tl] ModelName parameter=value ... • Selft=1 and Rth>0 to enable Self-heating • 1 volt at the temperature nodes = 1 degree in temperature • “tl” node represents the initial local temperature of device which always corresponds to trise+temp • “dt” node represents the rise above trise+temp caused by thermal dissipation, whose value equals V(dt)-V(tl) • Device temperature=V(dt)-V(tl)+trise+temp
Using VBIC in Cadence • Need explicit external temperature nodes in the symbol to model inter-device thermal coupling by • Connecting thermal network between “dt” nodes, or • Adding VCVS between “tl” and “tlr” node • Customized VBIC 6-terminal (5-pin) symbol
Model Conversion • Most BJTs are defined with SGP model • A conversion from SGP to VBIC is needed • Only approximate conversion is possible • Some parameters are left unmapped such as Rth and Cth • Two approaches are provided • Manual conversion — done empirically andneedLocal Ratio Evaluation [2] • Program conversion — “official” program sgp_2_vbic[3]
VBIC mapping VBIC mapping VBIC mapping Rcx Rc Mc Mjc Xtf Xtf Rci 0 Cjcp Cjs Vtf Vtf Rbx Rbm Ps Vjs Itf Itf Rbi Rb-Rbm Ms Mjs Tr Tr Re Re Nei Nf Td Tf·Ptf/180 Is Is Iben Ise Ea Eg Nf Nf Nen Ne Eaie Eg Nr Nr Ibei Is/Bf Eaic Eg Fc Fc Ibci Is/Br Eane Eg Cje Cje Nci Nr Eanc Eg Pe Vje Ibcn Isc Xis Xti Me Mje Ncn Nc Xii Xti-Xtb Cjc Cjc·Xcjc Ikf Ikf Xin Xti-Xtb Cjep Cjc(1-Xcjc) Ikr Ikr Kfn Kf Pc Vjc Tf Tf Afn Af Parameters Mapping by sgp_2_vbic • Early Effect model is different • Need Vbe, Vbc to solve the 3 equations below
2-D Isotherm Plot- Lines Connecting Points of Equal Temperature 2-D Isotherm plots for a structure scaled to be the same as the P10 1X2X1 device.
Power Dissipation Profile for Forward Active Operation in the “Tub” of a DI BJT • J∙E (A/cm2 ∙ V/cm = Watts/cm3)product should have the same distribution as temperature.
UTA Thermal Model for Dielectrically Isolated BJT BCi Rmetal Ri,dist Rpoly TEMP dt trench trench Ra active Si BCa Rtr Ra,distr buried Oxide RbOx Rw substrate wafer TEMP
Rth Model and P10 Data 15W0051A1 15W0051A1 kOx,TR = 50% kOx, (effect of void) AISO,eff = 40% LW, (~45° spreading ‹) WAL = 9 microns (total interconnect) 12W0201A1 *15W0402A1 15W1002A1
Thermal-Electrical Analogy Heat flow equation in a solid [2] Voltage equation in a Transmission line [2] T1 T2
Circuit Analogy Topology Where ρ is density and Cp is specific heat capacity per unit mass. Fig. 3. A block of solid Fig. 4. Electrical model
CBC8 Device Geometry Fig. 1. a) Simplified top view of the layout for a NPN transistor with full dielectric isolation, the blue arrows define the Dtcomposite space; b) Cross sectional view of the NPN transistor in XX΄ direction. Taken from [1] Chen, et al., “Footprint Design Optimization in SiGeBiCMOS SOI Technology”, IEEE BCTM 13.2, 2008, pp. 208-211.
Thermal Model of a SiGe HBT • The structure of a typical SiGe HBT (Heterojunction Bipolar Transistor) [1] • The Electrical circuit topology (Cauer network) for the thermal analogy model Oxide
Circuit Model (cont’d) • The thermal resistances and capacitances calculated for each layer are used to build the Cauer network. C1 = Ctub/2 C2 = Ctub/2+Cox/2 C3 = Cox/2+Cw/2 R1 = Rtub R2 =Rox R3 =Rw Fig. 5. Typical Cauer Topology Fig. 6. Electrical equivalent network (Cauer) of the HBT
Estimation of Thermal Resistance and Capacitance of Si-tub • Theoretical values of Rth and Cth calculated using Masana’s Method[2] • The top surface of the Si-tub is the emitter Area and at the bottom it is bounded by the inner dimensions of the Si-tub. Fig. 1. Sketch of the volume of the material to be used in Rth and Cth calculations.
Si-tub Continued (Calculations) Where kiand ki+1 are the thermal conductivities of the ith and (i+1)thlayer, kL is that of the lateral boundary. Where ρ is density and cp is the heat capacity per unit mass.
Oxide Layer • The thermal resistance and capacitance of the oxide layer is also calculated using the Masana’s method[2]. • The upper and lower boundaries have the inner dimensions of the Si-tub. • As the thickness of the oxide is very small compared to the lateral dimensions, there is no spreading considered hence it is essentially the slab resistance that is calculated. • Thermal Capacitance is calculated using Cth=ρcpV
Si-Wafer • The Joy and Schilg’s (J & S) method [3] is used for calculation of Si-Wafer thermal resistance and capacitance. • J & S is chosen because of large wafer thickness compared to the lateral dimensions. In this limit, the Masana approach overestimates the thermal capacitance. • This analytical solution is a very good fit to the thermal resistance of a rectangular heat source. • An equivalent time constant is calculated for a single pole RC network which would require the same total energy to “charge” for the thermal transient response T(t). • The single pole thermal capacitance is calculated from the equivalent time constant obtained from thermal transient response.
Si-Wafer cont’d for for • The equivalent Cth is calculated using the expression for equivalent time constant τ • The integral to calculate τconverges slowly. • Hence 99% of RT is taken as the final value of T(t)/P to evaluate the integral.
Wafer τth Calculation Using Rinaldi’s [5] Linear Approximations • The Rth using J&S is given by • τth is calculated as the time at which Z(t) given in [2] reaches Rth*(1-1/e). Where • The single pole plot fit, Rinaldi & JS are shown for L = W = 10um • τth = 0.115us • Rth = 364.7 K/W • Cth =τth /Rth= 3.15E-10 J/K
Algebraic Compact Model Used • An algebraic compact model for calculating the thermal resistance is derived. • A thermal spreading angle of 45 degree (Si-tub and wafer)is a good approximation. • For wafer thickness = 700um, A = 100um2 ,the spreading angle is 41.3 degree. • L and W are the dimensions of the heat source and t is the thickness of the medium. • For the oxide layer the slab resistance is calculated. • The thickness, t, is assumed to be very large compared to L and W for the calculation of wafer thermal resistance.
Spreadsheet for Calculating the Rth and Cth • Calculations mentioned in the previous slides have been implemented in an Excel spreadsheet. • The Cauer to Foster network transformation is done. • The spreadsheet takes the dimensions of different layers of the devices and gives corresponding Cauer and Foster network values. This enables the calculation of time constants which can be converted into a single pole. The characteristic times for the Foster network appear on a impulse response plot. Fig. 7. Electrical equivalent Cauer network of the HBT Fig. 8. Electrical equivalent Foster network of the HBT
Experimental Data and Results • A square input was given to the base emitter junction with Vhigh=-900mV and Vlow=-1.04V, TON=10us and TP=20us. The collector resistor was biased at 1V. • Veb is a thermometer of the transistor junction temperature & typically for constant Ib, dVeb/dT ≈ -2mV/K • The transient response was measured at the base-emitter junction (Veb) [4] • The measurement results are Fig. 8. Measurement setup Fig. 9. Thermal transient response
One Dimensional Heat Flow in Silicon HEAT • A silicon structure can be sub-divided into several silicon slabs. • Each section contributes to the total Rth and Cth of the structure. If each section is of equal volume, their individual Rthand Cth should be equal in value. • To correspond to uniform heat flow, each section can be represented by a thermal resistance and half the total capacitance on each node of the resistor. SILICON Cth 2 SILICON AMBIENT Rth Cth 2
The Distributed Nature of the Heat Flow • The corresponding CTh /2 capacitors are aggregated at each node. • Note that the “ambient end”CTh /2 is short-circuited. • The distributed equivalent circuit analogy simulation is obtained from the following network. Rth n Cth 2n Rth n Rth n Rth n Cth n Cth n Cth n Rth = Total Thermal resistance for the silicon structure Cth= Total Thermal capacitance of the silicon structure n = number of sections A=area cp= thermal capacitance ρ=density t= thickness kp= thermal conductance
Comparison of Circuit Analogy to Davinci Simulation of the Heat Flow Dividing the structure into 10 sections. Considering a silicon structure of size 3.7umx2.5um x10um where i=1,2,3…n, n= number of sections Dotted line=Davinci simulation measurement Solid line = equivalent circuit simulation
Approximating the Distributed Circuit With a Single Pole Model • Converting the 10 element distributed model to a 1 pole model: • RTotal=Rth at ‘dc’ • ΔQTotal =(cp)(ρ)Tavg • For total heat consumption. Heat stored corresponds to charge stored for the equivalent circuit. Rth n Cth 2n Rth n Rth n Rth n Cth n Cth n Cth n
Comparison of Circuit Analogy to Davinci Simulation for Heat Flow
(cont’d) Results from equivalent circuit simulations Results from Davinci Simulation Results from device measurement Foster network Results from device measurement Cauer network Top of the tub Top of the oxide Top of the wafer
dt for VBIC-R1.5 model • Model: VBIC-R1.5. • “selft” flag set to 1. • No optimization done. • No external circuit connected. • Rth=5.8E+0 • Cth=96E-12
VBIC-R1.2 Y11 plot (optimized data) • For optimized data refer slide “Model Parameters”. • Circuit used is shown in “Circuit for Y parameters (optimized data)” slide.
- + 500 W 500 W vOUT 100 W vIN = 1 V P-P, t = 200 m-sec Effect of Rth on current feedback op-amp settling time
LMH6550 impulse thermal characteristics • LeCroy sampling oscilloscope (1MW input mode) • Maximum averaging (10000) • Input nominally +/- 1V with 50 micro-sec period and 50% duty cycle. • Fractional Gain Error = FGE
vIN Rising Response vIN FGE vOUT
vIN Falling Response vOUT FGE vIN
Current Feedback Op-Amp (CFOA) with Simple Current Mirror (CM) Bias sup
Large-signal Output Voltage Transient Analysis for CFOA with Simple CM Biasing
Hypothesis: The Thermal Tail is a Linear Superposition of the Contribution from each Individual Circuit Stick • The contribution of individual transistor to the total thermal tail. • Used six stick classifications according to transistor type and functionality. i.e. Q10stk3-pnp-bf and Q11stk4-npn-cm • Enabled the self-heating effect in the stick of interest and disabled the self-heating effect of the remaining transistors. • Simulated the contribution of each individual stick. • The total thermal tail simulated is essentially the sum of the individual thermal tail contributions of each circuit stick.