Download
1 / 41
410 likes | 510 Views
The West’s declining snowpack: is global warming to blame?. Philip Mote Climate Impacts Group University of Washington. 20th century decline in NH snow cover. R.D. Brown, J. Climate, 2000. Trends in snowpack. Use VIC and met data to evaluate trends, roles of temperature and precipitation.

E N D
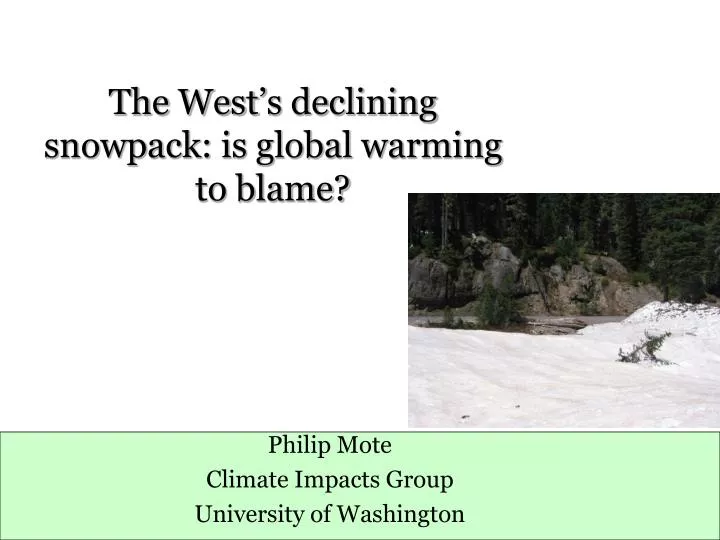
The West’s declining snowpack: is global warming to blame? Philip Mote Climate Impacts Group University of Washington
20th century decline in NH snow cover R.D. Brown, J. Climate, 2000
Trends in snowpack Use VIC and met data to evaluate trends, roles of temperature and precipitation
Snow course data Collected primarily ~April 1 beginning in 1915 (most in 1940s), added other months Purpose: streamflow forecasting Administered by USDA Natural Resource Conservation Service Mostly discontinued, some replaced by SNOTEL
Data: NRCS CA DWR BC SRM Courtesy USDA NRCS
decrease increase Trends in April 1 SWE, 1950-2000 824 snow courses 73% – trends Large – trends PNW Some + trends SW
decrease increase Trends in April 1 SWE, 1950-2000 Relative to 1950 value
Relating SWE to climate data • US Historical Climate Network (USHCN) • Use nearest 5 stations to form reference time series T(t) and P(t) • Regression: SWE(t)=aTT(t) + aPP(t)+(t)
At almost every USHCN station, winters warmed + signs: warming but not statistically significant
Winters wetter in much of the West Drier in some of Northwest (PDO)
Correlations between Nov-Mar climate and Apr 1 SWE X-direction: precip Y-direction: temp Coldest locations insensitive to temperature Cascades very sensitive
April 1 SWE trends, 1930-2002 aP<P> aT<T>
April 1 SWE trends, 1950-2002 aT<T> aP<P>
Declining snowpack in the Cascades From a simulation with a hydrology model
Trends in April 1 SWE in VIC simulation with fixed precipitation
As the West warms, winter flows rise and summer flows drop Figure by Iris Stewart, Scripps Inst. of Oceanog. (UC San Diego)
Simulation of future snowpack with VIC hydrologic model Trend in total April 1 snowpack, 1950-97: -11% Courtesy Andrew W. Wood, University of Washington
SNOTEL data: cold-season melt events vs Apr 1 SWE Figure by Martyn Clark, Univ. of Colorado
Regional average April 1 SWE Obs o VIC x
Trends/15yr in snow days in Switzerland From Scherrer et al., GRL 2004
Trends in Swiss snow days attributed to temperature and precipitation days/42 yrs. days/42 yrs. Attribution of trends shown by pseudo vectors; altitude and latitude precip and temp attributions; contour lines indicate the sum. From Scherrer et al., GRL 2004
Conclusions • Observations show substantial declines in western snowpack; corroboration with VIC suggests they are real and largely temperature-driven • Cascades, N. Calif most temp-sensitive • Large increases in precipitation have offset warming in some places • Is global warming causing the decline? Too soon to tell.