Download

1 / 35
360 likes | 576 Views
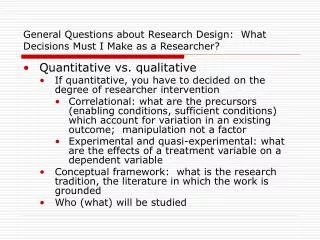
General Questions about Research Design: What Decisions Must I Make as a Researcher?. Quantitative vs. qualitative If quantitative, you have to decided on the degree of researcher intervention

E N D
General Questions about Research Design: What Decisions Must I Make as a Researcher? • Quantitative vs. qualitative • If quantitative, you have to decided on the degree of researcher intervention • Correlational: what are the precursors (enabling conditions, sufficient conditions) which account for variation in an existing outcome; manipulation not a factor • Experimental and quasi-experimental: what are the effects of a treatment variable on a dependent variable • Conceptual framework: what is the research tradition, the literature in which the work is grounded • Who (what) will be studied
General Questions about Research Design: What Decisions Must I Make as a Researcher?, cont’d • Plan for data collection and analysis • Data collection • Experiments; develop a plan for physical or statistical control of extraneous variables (e.g. exclude people of a certain age, or control for age) • Correlational: focus on design of measuring instruments and identification of possible alternative explanatory variables (you hypothesize that individualism/collectivism produces variation in attitudes towards technology; what other variables do you need to take into account/control for? • Analysis • Correlation and regression for non-experimental designs based on uncovering patterns of association • T-tests, ANOVA, MANOVA, for analyzing results of experiments and quasi-experiments
Experiments • A classic experiment involves randomly assigning participants to treatment groups and control groups, or in some other way to remove all possible differences between them other than the treatment to which they have been exposed (the manipulation) and then evaluate the outcome of the treatment • The assumption is that if all other between-group factors are controlled, any post-treatment differences between them can be attributed to the effects (can be said to be caused by) the treatment • Randomization in theory should reduce the likelihood of any systematic source of variation between groups that could impact outcomes; researcher does not have to specify every possible characteristic of the subjects which might be a confounding factor • Other physical control methods include matching or exclusion
Experiments, cont’d • Independent (Treatment) and Dependent (Outcome) Variables • Control Variable (covariate): like the educational attainment variable in the example of the association between gender and employment category. one whose potential effect can be confounded with effects of the treatment variable and must be removed through randomization or statistical controls • Virtually any variable may occupy one of these roles in a study and it is up to the researcher to clarify for any given study which variable is playing which role • Internal validity: refers to the internal logic of the study, ability to show that the putative IV causal impact on DV is legitimate and not attributable to other extraneous and uncontrolled variables • Ecological validity: design is good simulation of external circumstances and relationships among variables in the “real world”
Quasi-Experiments, “Natural Experiments,” and Non-Experiments • Quasi-experiments involve comparisons between naturally occurring treatment groups (by self-selection or administrative selection). Researcher does not control group assignment or treatment, but has control over when/what to observe (DV) • Example might be people in a face-to-face vs. distance education version of the same class; people who do or do not sign up to work at a polling place on election day; people named A-M versus N-Z • Researcher must rely on statistical controls (ANCOVA, partialling) to rule out extraneous variables which ordinarily would be controlled by randomization; should be variables suspected of a relationship to either DV or IV
Natural experiments and non-experimental designs • “Natural experiments” might typically involve before and after designs where you look at a DV of interest before and after some phenomenon that has occurred, for example, tying gyrations in the stock market to increases in oil prices or significant world events (sometimes classifed as quasi-experiments) • Non-experimental designs are basically cross-sectional studies which are correlational in nature in which the researcher makes an effort to establish causal influence through measuring and statistical control of competing explanations
Some Issues in Experimental Design • Typical experiment in which you attempt to compare two groups, one of which has been exposed to some sort of treatment (e.g., a message, watching a video, doing a task, etc) and one of which has not, on some variable of interest (attitudes, beliefs, etc) • Some things that you have to think about • How can you be sure in advance that your two groups do not already differ on the variable of interest (random assignment, analysis of covariance) • How can you be sure that your experimental manipulation is valid (validation studies, post-experimental “manipulation check” during debriefing). Validity decreases in the research setting as the role imposed on the subject by the experimenter departs from his or her usual role in comparable behavior settings outside the lab • How do you know that your post-treatment measures of the variable of interest are reliable (measure the individual’s “true score”)
Issues in Design of Research • Reliability analysis is particularly important in studies involving pre/post test measures where change scores are computed (test-retest reliability can be affected by issues of memory, maturation, development, and random error) • Replicability (have your manipulations and measures been chosen and implemented (and will you be able to report them) in such a way that other experimenters could replicate your experiment?
Some Issues in Experimental Design, cont’d • Demand characteristics: refers to features of an experimental setting or questionnaire which induce people to behave in an artificial way • In our society the role of subject and experimenter are fairly well understood and carry with them mutual role expectations • Many subjects, particularly college students, have expectations that you might be “trying to prove something” and depending on whether or not they like you, may try to help you prove it by altering their behavior consistent with their understanding of what you “want them to prove” • Often their notions about your hypothesis are incorrect • People may also feel pressure to make a good showing for themselves by answering questionnaires in a non-truthful way that makes them look good to the experimenter • Testing for social desirability effects
Issues in Design of experiments, cont’d • Sometimes the mere process of measurement (for example, taking a pre-experiment attitude survey) may induce change that will later be incorrectly atttibuted to intervening events, such as the experimental treatment (message about the survey topic). That is, simply asking questions about a topic may induce attitudes to change even for the “don’t know” group • People can make improved scores on tests just by repeated experience (intelligence tests, for example) even if they don’t get feedback as to right or wrong answers • Experimenter characteristics: characteristics of the interviewer or experimenter can influence results, with different responses depending on gender, race of experimenter as well as changes in the E’s skill or interest • Interpretations: Experimenters can be influenced by early data returns in
Potential Sources of Confounding • Method variance • Different experimenters for different conditions • Lack of uniformity in conditions of measurement (for example, letting some Ss “take home” a survey or giving them additional time to complete it; using an interview for some subjects (perhaps due to lack of literacy) and a paper and pencil measure for others • Differences in instructional set (typically experimenters begin to memorize their instructions over time, but they then forget parts or say things differently to the first few subjects than they do to the last few) • Different recruitment strategies or different incentives for participation will result in different kinds of subjects, so be consistent in both regards within a single study
Correlational Studies • Objective is, minimally, to be able to say that variation in an IV (call it “X”) accounts for (“explains”) variation in a DV (call it “Y”; characterizing the IV as causal is a bigger leap, as although X could cause Y, there is nothing in the correlational relationship to say that Y doesn’t cause X, or that both aren’t caused by Z • In most social science research today it would be regarded as unsophisticated to present a simple correlational analysis in which one variable was proposed as accounting for variation in another • Techniques (multiple regression, SEM) exist which allow us to simultaneously investigate the separate and combined effects of multiple variables as they interact to account for variance in a DV.
Correlational analysis, cont’d • Using multiple regression/SEM techniques we can systematically observe the contribution of individual IVs and various combinations of IVs and measure the extent to which they increase or decrease the amount of variance in the DV which can be explained • Techniques like step-wise multiple regression allow us to include or remove predictor variables (IVs) in a progressive fashion to see how they contribute or take away from a combination of variables in accounting for larger and larger portions of the variation in a DV • Techniques like hierarchical linear modeling (HLM, also called multilevel modeling) allow us to account for the effects of nesting (e.g., individuals within couples, students within classrooms), so we can sort out the impact of any lack of independence of the observations we make on, say, a husband and wife, or among the students of the same classroom teacher
When to Use Measurement • Measurement is appropriate when there is a quality or property which we know how to describe, which we think can be arrayed along a continuum of some sort with identifiable signposts that tell us at the very least whether or not a given instance of the property constitutes a little or a lot of it • Further, measurement requires that the quality or property we propose to measure is comparatively stable over time (like height in middle aged adults), or varies in a systematic way. • You might think that under that criterion you couldn’t measure weight, because we all know that we gain weight in mysterious and unpredictable ways, overnight • But in fact it’s a systematic process having to do with energy intake and energy expenditure that can be described as evidencing certain regularities
The view from the other side… • There are certain paradigmatic objections to the whole notion of measurement on the grounds that there is no objective reality, even if people behave as though there is; that behavior is socially constructed; and that dissecting the behavior stream and assigning it numbers (1,2,3,,,7,87,9) is essentially throwing away data by reducing a phenomenon experienced analogically and holistically to a set of categories, no matter how fine the categories
Some Fundamentals of Measurement • Assumption that a measuring instrument only provides indicators of or clues to an underlying trait which cannot be observed directly • The measurement instrument should consist of items which constitute a representative sample of the universe of items which could be regarded as indices of the trait • Basic types of scales • Likert: (*you say lick-urt and I say like-urt”) strongly agree/strongly disagree to declarative statements, 5-7 scale steps • Thurstone: series of statements thought to represent equally spaced intervals of attitudes toward a target stimulus along a bipolar continuum, e.g. I am a very strong proponent of the legalization of marijuana; I am in favor of the legalization of marijuana as long as it’s sale is regulated like cigarettes;…. I am opposed to the legalization of marijuana except for pain relief by cancer patients; I am an opponent of the legalization of marijuana in all circumstances • Guttman: ordered series of statements which are arrayed in a pattern of increasingly polarized positions on an issue, such as acceptance of gay marriage. Subjects indicate which items they agree/disagree with. Assumption that the scale is cumulative; that is, if you agree with a “very strong” item, you also agree to the less-extreme items below it • Semantic differential scales: an object of judgment is evaluated against a set of rating scales (usually five to seven steps) with bi-polar adjectives at either end, such as good-bad or friendly-unfriendly
Constructing a New Measure vs. Utilizing an Existing One • For your purposes it would be to your advantage to use an existing instrument with published reliability and validity coefficients • The best way to find these is through Googling for the construct keyword plus terms like “scale” or “measure” and perhaps restricting your search to PDF files, or to .edu domains. “Paper presented at” or “annual meeting” are good phrases to accompany the construct keyword • PsychInfo is another very good source. Access this from an on-campus computer or home computer through the remote access portal. It’s found on the ISD Electronic Resources Page in the Quick Links menu.
Some Issues in Questionnaire Design if You Must Create Your Own • Provide as clear as description of your construct as possible; then narrow it and narrow it some more • Consider how it will manifest itself under many different circumstances • Consider what other constructs it might be closely related to and how it differs from those other constructs (ex., speech apprehension, shyness, social anxiety); trait vs. state • Select a measurement type. For your purposes probably Likert-type scales or semantic differential scales will be sufficient • Likert scales would be used with declarative statements about the construct, e.g., “I thought that the person depicted in this video was very friendly” with a scale below it of 5-7 steps ranging from strongly agree to strongly disagree • Semantic differential scales would be used to elicit attributes associated with the construct or stimulus: e.g. • person depicted in video • Friendly ----- ----- ----- ----- ----- ----- ----- Unfriendly • Unpleasant ----- ----- ----- ----- ----- ----- ----- Pleasant
Some Issues in Questionnaire Design if You Must Create Your Own, cont’d • Some problems with response to questionnaires that you should keep in mind whether designing your own or using an existing one • People will develop “response sets” to respond to surveys in a particular way • They may like only the “neutral” category, or like to respond only on the right-hand side of the page because it’s easier (so generally we would rotate some items) • Fatigue factor: interest tends to decline as subjects become tired, and responses to later items may be less thoughtful, skipped, etc. so best to rotate order of items • Order effects: primacy and recency effects (argues for counterbalancing) • Generally people are more likely to endorse a statement than to disagree with its opposite
Further Issues In Questionnaire Design • Items which are ambiguously worded can produce what’s called an “acquiescence set” • Although people generally prefer to endorse strong statements rather than moderate or indecisive ones • Yet items with “always” or “never” tend to be rejected as too inclusive • Subjects prefer round numbers (2,4,6,etc) if response categories are numbered • Some items may be culturally unacceptable. For example, in one study the item asked how frequently respondents have “the feeling I am going crazy.” Most of the 350 Vietnamese subjects refused to answer—they knew what was meant, but it was a strong norm to conceal or deny mental illness. • This is a feature of almost any population. People are likely to seriously under-report their socially undesirable behaviors and over-report their desirable ones. Problem can be reduced by confidentiality assurances, removal of survey process from the presence of an experimenter or perceived evaluator
Further Issues In Questionnaire Design, cont’d: Validity and Reliability • To review from previous slides • Reliability : internal consistency of measure; alternatively, consistency of measurement over time with the same subject, case, instance. Test-retest; alpha coefficient More on how to compute reliability in lesson on February 26 • Validity: does the measure really assess what it claims it does? Face, concurrent, predictive, construct (convergent validity and discriminant validity) • Convergent validity : your new measure of social anxiety is positively related to established measures of self-consciousness or shyness • Discriminant validity: your new measure of support for the death penalty is negatively related to an established measure of political conservatism
Further Issues In Questionnaire Design, cont’d: Validity and Reliability • If you are using an existing measure, look for articles in which it is used and validity and/or reliability data has been collected and reported • Validity and reliability should be reported as coefficients ranging between 0 and 1. Typically you will see reliability reported in terms of an alpha value. This is a measure of internal consistency of scale items and should be at least .8 or better • Validity is more rarely reported by users, more often by the original scale developer
Collecting Data • Try to define the population from which you will collect data and if possible create a sampling frame from which you can randomly sample to obtain respondents • If a sampling frame for the population of subjects cannot be defined, then try to narrow the range of persons or entities (or other cases, such as geographical units, web sites, tv shows, etc) to which you hope to generalize and prepare a list and sample from it. The point is to provide a replicable method and to provide every element in the population of interest an equal chance to be included. • Prepare an consent form or information sheet for dissemination to your respondents. Secure IRB approval for your project. Consult the syllabus or previous slides for links, templates, etc. • You would be likely to need a consent form only if you were planning to collect personally identifying information, use deception, subject them to some possibly harmful treatment, etc. • Secure participants’ consent and provide a copy of the consent form/information sheet to them. The consent form should be countersigned by you and a copy returned to the respondent (make two copies if you are collecting signed consent) • An information sheet can just be a separate page at the beginning of your questionnaire • Collect all data under consistent conditions; no method variance allowed
Special Topics in Data Collection: Web Surveys • Don Dillman is a leading researcher in the field of surveys. He has an excellent article with practical advice for constructing Web surveys. Here are the high points: • Realize that some users may not be able to complete questionnaires which use high-end programming techniques because of browser or computer limitations, so keep in mind the computing resources of your target population • Don’t up-end the usual method of filling out questionnaires that people are accustomed to in order to “take advantage of” the advanced design features of Web programming languages and multimedia • Some people may use Web questionnaires in mixed-mode situations (in combination with paper surveys, for example). While this invites method variance, it may be unavoidable. If this is the case, take care to make the questionnaire format as consistent as possible across methods
More on Web Questionnaires • Use a welcome screen to motivate and inform (and of course to obtain agreement to participate) • Emphasize ease of response and make it clear how to proceed to participation • Begin the questionnaire with a fully visible, easy question • Present questions in the same way they usually appear on paper questionnaires • Keep line lengths short to avoid participants’ skipping words • If particular computer functions are necessary to complete a question, explain it if you think it would be necessary for the type of respondent you expect. For example, with radio buttons explain that only one item can be checked. Drop-down menus are hard for some people to negotiate and tend to encourage people to choose wherever they land. Indicate if the available space exceeds the apparent space for an open-ended answer, etc. • Place these instructions near the question, not at the beginning
More on Web Questionnaires, 2 • Deal with the “forced answer” problem. Some IRBs (like USC’s) don’t like the quality of Web surveys that require that every item or even some items be answered and want you to assure subjects that their participation is strictly voluntary, which may extend to being able to opt out of any question they don’t like. You could approach this in a couple of ways • Require only that they agree to the “consent item”-an item like, I have read the information sheet and I am willing to participate in this study • Provide a “don’t wish to answer” alternative for every item which you will later treat as missing data, but require them to indicate formally that they don’t wish to answer and don’t let them submit the form until they do • You could provide some gentle encouragement for really critical items. For example, you could set required fields for the critical items and if they don’t answer or select don’t want to answer they could receive a screen which suggests that their answer is really important and if they could find a way to reply it would be helpful to the study. IRBs might differ as to how coercive this is, and you might not like it either
More on Web Surveys, 3 • In general, surveys should scroll from question to question unless they are really long. • For a long questionnaire, give the respondent an idea of how far along in the process they are from time to time. Use words or simple graphics • Realize that “check all that apply” formats probably will yield different results than if you listed each potentially applicable item and put yes or no radio buttons next to it
Special Problems in Data Collection: Some Guidelines on Conducting Face-to-Face Interviews • Check to see if your interviewee has completed the consent form process or has read the information sheet and agreed to participate • Find a suitable, comfortable, quiet spot for the interview. It is important that it be comfortable for the interviewee, as fatigue can be a factor. The additional stimulus of another person increases the level of arousal during the interview compared to a paper and pencil questionnaire and can produce anxiety and fatigue; these can be major problems if you are interviewing the very old, or children, or interviewing people standing up or on their way to or from somewhere-adjust the length accordingly • During the interview if the respondent begins to look tired or bored it is appropriate to suggest taking a short break.
Interviews, continued • During a long interview, look for signs of restlessness or impatience that may be indicators of fatigue. Look ahead to see how many questions remain, inform the participant and ask if he or she needs a break, or has to stop. • Explain some general guidelines before you begin: • Tell the interviewees that you will mostly ask questions and write down their answers on a piece of paper. • For any which is sensitive, such as one which asks about income, sex, drug use, etc, you can have them circle the answer on a sheet of paper so that they don’t have to say it aloud in front of you • Be prepared that some items may seem ambiguous and you may have to provide definitions. Give the same definition to anyone who asks
More about Face-to-Face Interviewing • Sometimes in an interview when you are asking for scaled responses it is useful to provide printed response cards with the scale alternatives • Explain that you will point at the appropriate response scale and they can point at the alternative that they think best answers the question (e.g., strongly agree, agree, etc.) • Let them know that they have a right to decline to answer any question, and that they don’t have to give a reason for why they don’t want to answer it. • There is potential for embarrassment with respect to questions about certain subjects. Look for signals that the participant is reluctant. These signals might be questions about the use of the data, clearing of throat, behaviors indicating distraction, nervous gestures. Participants should be reminded that they can skip any question. • Let them know that they can stop the interview altogether at any time and they will still be compensated with whatever compensation you may have offered, or that you will still be able to “use their answers”
More on Face-to-Face Interviews • What your demeanor should be like (and this advice applies to any data collection context, including experiments and survey administration): • Don’t be overly friendly to the interviewees, merely polite and pleasant; otherwise, they may try to give positive answers to please you • Don’t react to or comment on the interviewee’s answers • Don’t allow the interviewee to engage you in chat. Say, “I’ll be happy to talk about that when we’ve finished the interview questions.” • Be encouraging but don’t force them if they are reluctant to answer • Keep any ideas about the hypotheses of the study or why certain questions are being asked strictly to yourself
Special Issues with Multilingual Populations: Major Problem Areas • Lack of semantic equivalence across languages—problems of finding words or phrases in the target language that are the same or similar in meaning in the source language. • Lack of conceptual equivalence across languages—the concepts which the researcher operationalizes in the source language may not exist in the same form in the target culture; these concepts may not even be part of their thinking. • Norms which govern behavior may not be consistent across cultures • there may be more or less openness or willingness to talk about certain topics such as politics, money, family matters • in some cultures people may be very assertive, or be very willing to say positive things about themselves, while in others modesty is more normative • in some societies there will be a preference for giving positive responses to make the interviewer happy; in other cultures, the interviewer may be regarded with suspicion and deliberately not be given correct information • there is wide variation in how likely respondents from different cultures are to use the end-points of scales; in certain cultures respondents cling to the middle choices, while others prefer the extremes • the Western custom of repeating questions to ensure reliability may make the interviewer look stupid or as if she or he has a poor memory
Problems with Backtranslation Process • You may decided you want to ask questions in a language other than English and decide to try to translate a questionnaire yourself • It’s typical to take the original English version, translate it into, say, Spanish, and then have it backtranslated to English and compare the two English versions • Can be subject to false equivalence because the backtranslator is familiar with the research construct and can guess what the items should be • Can be subject to false equivalence because the backtranslator is familiar with the grammatical structure of the target language and can guess what the items should be • Be wary of literal translation of idioms and metaphors as they probably will not have the same connotation in the target language. For example, English expressions like “lending a hand” may not translate well. Explore alternatives to literal translations that capture the intent but not the letter of the original • {Source: Behling and Law, Translating Questionnaries and Other Research Instruments.
Debriefing: After Collecting the Data • Debriefing is an important part of any study, no matter how you conduct it, although you may have to debrief by email or a special password-protected URL for a Web study • Purpose of debriefing is twofold: • To attend to the post-study needs of subjects for information, assurances, giving feedback • To gain information that will help you assess the effectiveness of experimental manipulations and improve your design for subsequent studies • Some things that should be covered in a debriefing: • Information provided to the subject • A brief account of the purpose of the study and what you hoped to learn • An explanation of any deception that may have occurred, particularly as it might affect the subject’s self-evaluation (e.g. bogus test feedback) • Promise to provide copy of the results • Information gained from the subject • Open-ended or scaled responses to questions about experience as a participant in the study, including opinion of the experimenter (confederate) • Manipulation check • Agreement not to reveal the nature of the experiment to other potential subjects
Analyzing the Data • We have already talked about about statistical tests that are suitable for use with nominal (categorical) data. We will continue to talk about what kinds of tests are used with what sorts of hypotheses • Contingency table tests (Chi-square) already done • Single-sample tests of means and proportions (t) done some of this • Two-sample tests of means and proportions (t for independent samples, paired samples) doing next • Analysis of Variance and ANCOVA • Two-way Analysis of Variance • MANOVA • Correlation Analysis • Multiple Regression Analysis • Factor Analysis • Discriminant Analysis and Classification • Multidimensional Scaling and Cluster Analysis (maybe) • Reliability