Download
1 / 22
220 likes | 347 Views
Cost of Service Water Rate Study Habib Isaac – Principal Greg Tobler – Task Manager May 14, 2012. Project Objectives. Develop water rate structures that: Provide adequate revenues in short and long term Update and incorporate CIP Strong financial outlook for utility

E N D
Cost of Service Water Rate StudyHabib Isaac – Principal Greg Tobler – Task Manager May 14, 2012
Project Objectives • Develop water rate structures that: • Provide adequate revenues in short and long term • Update and incorporate CIP • Strong financial outlook for utility • Minimize revenue adjustments • Rate Design • Are defensible / equitable across customer classes • Consider ability to pay / affordability • Minimize rate shock
Revenue Requirements Analysis Additional Considerations • Determine revenue needed to meet utility costs • Project O&M, capital, and debt expenses • Analyze reserves
Revenue Requirements • Analyzed EGWD Budget • EGWD financials embedded within model • Model may be used as part of budgetary process • Accounted for specific adjustments • Capital Improvement Plan • Debt Management • 10-year projection • Reserves • Established financial thresholds • Created multiple scenarios to reach five year goal
Variable Assumptions Toggles and Inputs Programmed scenarios for quick comparisons Visualize impacts on revenue & rates immediately Financial Thresholds
Scenarios are quickly run with a push of the “Run Scenario Button” GUIDE provides the ability to save, name, and compare scenarios to determine the optimal financial plan.
Key Variables: • Numerous assumptions that are easy to modify allow for easy and instantaneous, yet complex, scenario planning • Assumptions • Include: • Purchased Water • Power • Inflation • Reserve Policies • Debt Management • Reserves Funded
Revenue Options Scenarios
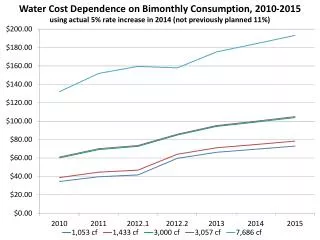
Revenue Adjustments Based on Annual Needs • Reserves allow District to defer two years of increases • 4th and 5th yr adjustments @ 9% and 11%, respectively • Bond covenants maintained and reserves funded • Yearly fluctuations in revenue collection • Rate shock to customers starting in 4th year • Reactive approach to utility’s 5yr/10yr financial plan
One Year Delay on Revenue Adjustments • O&M Reserve equals 180 days of O&M • Reserves allow District to defer adjustment for 1 year • Revenue adjustments of 4% , 4%, 4%, 6% for remaining years • Bond covenants satisfied • District already has three years of 3% adjustments approved • Essentially two years of new increase (Years 4 and 5) • Allows economy to recover • Years 6 through 10 not pro-actively considered
3% Revenue Adjustments • Revenue adjustments of 3% for next five years • District already has three years of 3% adjustments approved • O&M Reserve adjusted from 180 days to 120 days • Reserves fully funded – including reserve programs • Bond covenants satisfied • CIP funded with a combination of existing Debt and PAYGO • Higher increases necessary in later years
O&M Reserves Adjusted to 90-Days • District already has three years of 3% adjustments approved • O&M Reserve adjusted from 180 days to 90 days • All five years reflect 3% revenue adjustments • Reserves fully funded – including reserve programs • CIP funded with a combination of existing Debt and PAYGO • Bond covenants satisfied • Funds short-term and long-term needs • Years 6-10 revenue adjustments range between 4%-6%
Debt Restructure with 90-Day O&M Reserve • O&M Reserve adjusted from 180 days to 90 days • Debt management allows District to take advantage of current market conditions • Debt obligation reduced • Bond covenants easier to satisfy • Reserves fully funded – including reserve programs • CIP funded with a combination of refinanced Debt and PAYGO • May consider funding certain improvements with debt restructure • Funds short-term and long-term needs • Revenue adjustments in years 6-10 limited to 3%-4%
Next Steps • Incorporate consumption data into model • Review and correlate CIP with depreciation • Rate Design • Analyze peaking factors and demand characteristics • Set unique rates for each customer class • Discuss tiered structure • Options for residential • Conservation objectives • Collaborate with EGWD staff throughout rate design process