Entity Relationship Diagram (ERD) Guide for Database Design
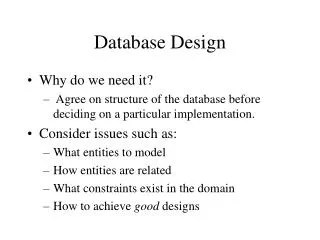
Understand ERD, entities, attributes, and relationships in database design. Learn about tables, keys, and database modeling concepts. Important steps and considerations in designing a database.

Entity Relationship Diagram (ERD) Guide for Database Design
E N D
Presentation Transcript
ERD • Entity Relational Diagram (ERD) • Visual display of tables and their relationships for a database • Used for “Relational Modeling”
ERD cont. • SQUARESindicate TABLES • LINESbetween them indicate the different relationships • “FEET” at end of line, indicates a “MANY” relationship • -1CUSTOMER has MANY “receipts” • -1STAFF MEMBER sells MANY“receipts” • -1PRODUCTcan go into many different “receipts” • Each product has to be INDIVIDUALLYlisted
ERD cont. • IFI wanted to know whosold me the order, I have to go to the receipt (order ) , in the “RECEIPT”table, I’ll find who the STAFF MEMBER is who sold me that receipt • IFI wanted to know what product a CUSTOMER has ordered, I have to go to the receipt (order ), in the “PRODUCT” table • -NO DIRECT relationship BETWEEN : • CUSTOMER& STAFF, or • CUSTOMER & PRODUCT
What are Tables or Entities • Used to represent thingsin the “real world” that is of significant interest to the user • i.e. “EMPLOYEES” might be an “Entity” in a company database • NOUNS in a “Business Narrative” • each tableis called an “entity” and the columns are referred to as an “attribute”. • within a table , each rowis called a “record” and it represents 1particular instanceof its “entity” (not unlike the flat file). Employees
Entities Continued • Another example: • A database regarding music • Artist & Song are both tables • “Performs”is the relationship (VERB) (usually is a “supporting document” which explains the relationship)
Entities and Their Attributes • “Entities” represent something of importance • “Entities” are made up of several “Attributes” (the columns), which describe the tables:
Entities Summarized • Each ENTITY is made up of rows and columns • Columns are called fields or attributes of a database • Rows are called records or an instance of an entity • If you have repetitiveVALUESto 1attribute, —create a: “JOINER TABLE” or “LOOKUP TABLE” • make this attribute a “Foreign” key • Create another table withsame attribute • i.e. a: “Shoe Table” with “colours” • “Colours”will be a “Foreign” key, here: with “ColourID” • primary key in a new table called: colours, with “ColourID” • 8-10attributesperTABLE, after that create anothertable
Entities Summarized cont. • OR:When a table has the SAME VALUEREPETITIVELY for that attribute, you might need a “LOOKUP TABLE”: • People might misspell, the value, then you can’t do a: SEARCH • i.e. LEVEL OF EDUCATION • “Masters” • What if 1 person spells it: “Masters” • Another person “Master” • Another person Masters of Education • You will have multiple occurences of 1VALUE which takes up too much space in your database
Steps in Database Design • Complete a “Needs Assessment” (note: this is a huge process that is not covered in this course) • Basically, you speak with end users, managers, existing documents and think “outside the box” • If, in the design of the database, there is multiple occurrences of data (think of our “gender” example) this is an indicator that another table should be created. • Create a “Business Narrative” • Identify entities • Identify attributes & keys • Identify relationships
Business Narrative • Vital link between database designer and the end users • Purpose is to make clear the “data requirements” • The story, business rules, purposes of database; what kind of info it will hold • Will have to go over the DESIGN multiple times/days to make sure the DESIGN is correct • Get other people/users to comment on design • Example: • “Algonquin college employs many instructors to deliver various programs comprised of many different courses. “
Starting an ERD • Identify the “entities” • Look at NOUNSof the “Business Narrative” “Algonquin college employs many instructorsto deliver various programs comprised of many different courses.” programs instructors courses
When the list of Entities Seems Complete • Ask about each “entity”: • Is it significant? • List only entities that are important to your databaseusers and that are worth the trouble and expense of computer tabulation. • Is it generic? • List only types of things, notindividual instances • “EMPLOYEES”, “INSTRUCTORS” are generic of many different instances—we don’t say “Joe” • Is it fundamental? • List only entities that exist independently and do not need something else to explain them. • “Courses”-explains itself, you don’t need further elaboration
Three Basic Types of Relationships • One to One (1:1) • One to Many (1:M) • Many to Many (M:M) • The 1 is the “PARENT”, and the M is the “CHILD” • Called the CARDINALITY of the relationship • The cardinality indicates the MAXIMUM number of RELATIONSHIPS between the entities, • Whenever you see: “MANY”—this will be the FOREIGN KEY
One to One Relationships • 1:1 relationships exists when a single record in one table has 1 and only 1corresponding record in anothertable, and vice versa • VERY RARE • When you created a table for something, when it really should only have been a “field” • The 1should really have been an “attribute” of the other (table/entity) an attributeIMPROPERLY DEFINED as an entity • i.e. 1customer,1address • “Address” should have been the attribute of the “Customer” table
One to One Example • A voter can cast only one vote in an election. • A ballot paper can belong to only one voter. • So there will be a 1:1relationship between a Voter and a Ballot Paper. Voter Ballot
One to Many Relationships • MOST COMMON • 1:M or M:1 • Relationship exists when a record can relate to 1OR MORE records in a 2nd table but.. • A record in the 2nd table can ONLY relate to 1record in the 1sttable
One to Many Example • A person can own more than one car. A car can only have one owner. Owner Vehicle
Many to Many Relationships • M:M • Relationship exists when 1record in eithertable can relate to more than 1record in the othertable • These should be eliminated • 2 related “PARENT”tables, but their relationship is NOT “direct” • Instead, it needs to be related through an additional “CHILD” table
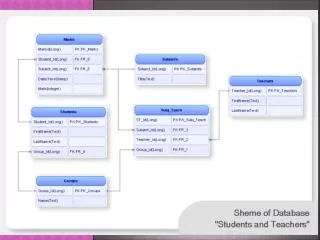
Many to Many Example • A student can have more than one professor; the same professor can have many students • WATCH THIS VIDEO Student Professor
Resolving Many to Many • M:M is not allowed, as an attribute could have more than 1value: • A “Multi-Valued Attribute” • Difficult to generate reports, or do searches • Would have to repeat attributesmultiple times • Instead, we create a “JUNCTION” or “JOINER ENTITY” • The name of the joiner entity is often a COMBINATION of the 2 entities Student Stud_Prof Professor
Resolving Many to Many Relationships ByCreating A Junction Or Joiner Entity • WATCH THIS VIDEO
SHEETS OF ICE • 1 arena with many sheets • ARENA ID-primary key in ARENA table • Add a FOREIGN KEY to SHEETS OF ICE (AREN_AID) • Can a sheets of ice belong to many arenas? NO—so we know it’s a one-to-many • TEAMS table-PRIMARY KEY: TEAM ID to PLAYERS table FOREIGN KEY: TEAM ID
Normalization • Refining the ERD • Task of analyzing entities and the relationships created have been formalized into a process called normalization. • Should resolve all your relationships to One to Many (1:M)relationships • Eliminate all One to One’s (1:1) and Many to Many’s(M:M)
Selecting Attributes • Attributes are the fields/columns that describe an entity • Attributes can be: • A Characteristic • A Quality • A Feature • A Fact • An attribute is a “non-decomposable” piece of information about an entity • Can’t be broken down any further, only 1 single value per column • i.e. NAME—last name, 1st name • Attribute “Naming Conventions” • Single word (or more than 1 word with an underscore(no spaces) • Unique • Can’t be a reserved word” • i.e. “Number”, “Date” ( these are date types), OR name of column can’t be same as name oftable
ONLY WATCH UNTIL 5minutes 31 seconds (until it mentions: “QUERYSMITH”) • http://www.youtube.com/watch?v=Y-bvjtYgRVU
ASSIGNMENTS-BE CAREFUL WHEN DOWNLOADING“CHEATING” possibilities • BE CAREFUL when you are DOWNLOADING your assignment files. When you DOWNLOAD them, the files come with an embedded ENCRYPTION code • IF you COPY THE FILEfrom another student, your assignment will be flagged with a “POTENTIAL INTEGRITY VIOLATION”,(cheating). • EVEN IF YOU SEND AN UNedited file, you may be legitimately doing your own work, but, the file has the ENCRYPTION code • your assignment will be flagged with a “POTENTIAL INTEGRITY VIOLATION”,(cheating).
ASSIGNMENTS—READ INSTRUCTIONS VERY, VERY CAREFULLY!! • You have to be very, very careful with ALL the components in myitlab. The software is extremely specific—it IS case-sensitive, and if you add a spacewhere there shouldn’t be (or vice versa), or forget to include a punctuation mark(or vice versa), myitlab will mark it wrong. • When you do your assignments, you must read the instructions extremely carefully, not “skimming over” any of the instructions, just in case you miss a tiny requirement.
PRINT OUT ASSIGNMENT MARKS • Please make sure that as soon asyou get your MARK for ANYassignment, that you do the following: • DO NOT CLOSE the dialog box with your mark on it--before doing the following: 1. Hit your PRINT SCREEN button on your keyboard 2. Open MS WORD 3. PASTE 4. Enlarge the “screen capture”, so that it’s readable 5. PRINT out your MARK, AND SAVEthe file to the DESKTOP -then UPLOAD the file to SkyDrive 6. You may now close the dialog box. • There have been some students who have gotten their mark, but when they close the dialog box with the mark on it-- they receive a “0” in their GRADEBOOK. (This is the mark that Isee). This “print out” will be your backup copy—put it in a safe place, until the endof the semester.
SUBMITTING ASSIGNMENTS: • CLICK ON: UPLOAD COMPLETED FILE • BROWSE to where your file is > UPLOAD>FINISH: SUBMIT FOR GRADING After submitting assignment, there is a time lapse. You can view results by going to VIEW SUBMISSIONS
Will give 3 files: • SUBMITTED FILE • SUMMARY REPORT • MARKED UP REPORT • SUBMITTED FILE • Opens a .zip file which is a COPY of the file you submitted for your assignment
SUMMARY REPORT: • click on the arrow to EXPAND the information, to • find out exactly where you went wrong.
MARKED UP REPORT: • Click on the check-markor x-icons to view the detailed results and score of the corresponding instruction step. • If the project required you to insert images or art, those items are hyperlinked and can be selected for more details. • Missing items are highlighted in tan color. • Hidden elements are highlighted in pale yellow color. • Elements that were to be deleted are highlighted in orange color.
REMOVE SORT • HOMEtab, in the SORT & FILTERgroup, click the REMOVE SORTbutton:
FILTER BY SELECTION in a “TABLE” • HOME > SORT & FILTER group > click on the FILTER icon > • To FILTER: • Click on the drop-down arrow on the COLUMN HEADING (field) you want to filter • Select or de-select the VALUES you want to filter
NUMBER FILTERS • Click on the drop-down arrow on the COLUMN HEADING (field) you want to filter • NUMBER FILTERS > select one of this options: • When you select “Less Than” or • “Greater Than”, by default it will • Also contain “Equal To”, so key in • The next number UP (for GREATER than), or The next number DOWN(for LESS than) • I.E. If you want >200, you would have to key in >201 (as it contains “equal to”, and will flag “200” also)
FILTER BY FORM • SORT & FILTER group • ADVANCED button • FILTER BY FORM
FILTER BY SELECTION in a “QUERY” • To filter all the rows in a table that contain a value that matches a selectedvalue in a row • Right-click the VALUE you want to filter. > select: “EQUALS” the specific value you want • IF A FILTER IS ALREADY APPLIED: • HOMEtab,> SORT & FILTER group, > Advanced, > click: CLEAR ALL FILTERS.
ADDING A “TOTAL” ROW IN A QUERY • QUERY TOOLS DESIGN tab, > SHOW/HIDE group, click the TOTALS button • In the TOTALrowbelow the AMOUNT field, click the drop-down arrow and select: MIN. • DESIGNtab, > RESULTSgroup, > RUNbutton. • VIEW the query in DESIGN view
HYBRID: MYITLAB • MYITLAB HOMEWORK: • myitlabTRAINING: Access VOLUME 1- “Skill-Based TRAINING” • myitlabASSIGNMENT: • “EXPLORING series” • Access Chapter 1- GRADER PROJECT [HOMEWORK]