Download
1 / 33
330 likes | 431 Views
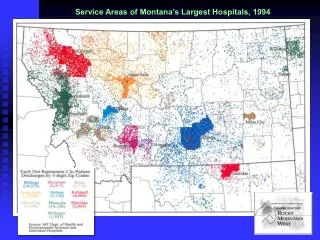
Service Areas of Montana’s Largest Hospitals, 1994. Regional Service Area of Western Montana Clinic 1992 – 1994 The dots in the map show the area from which patients served by Western Montana Clinic come.

E N D
Regional Service Area of Western Montana Clinic 1992 – 1994 The dots in the map show the area from which patients served by Western Montana Clinic come. Each dot represents 10 patients from the more than 200,000 patients served over a three-year period.
Hospital Care Service Areas for Smaller Hospitals Nearby Missoula
Metropolitan Statistical Areas with the Highest Dependencies on Health Care Nationwide There are 366 metropolitan statistical areas in the entire U.S. and the chart at the right identifies and rank orders those that have the highest economic dependencies on health care as an area provider of employment income. This dependency is measured by calculating how much labor income in generated by an area’s health care sector for every $20 million in area total personal income. Rochester, MN, home of the Mayo Clinic, has the highest dependency on health care of any metropolitan area in the U.S. with over $7 million in health care labor earnings for every $20 million in area personal income. Interestingly enough, Missoula ranks 22nd in its dependency on health care for employment earnings with $2.43 million in health care labor income for every $20 million in personal income.
Missoula’s Rank Among All MSAs under 160,000 Population in Health Care Sector Dependency Nationwide Of the 366 MSAs nationwide in the U.S., 124 of them have populations of under 160,000. When you take out the very largest and most populated MSAs and then compare the remaining ones in terms of their economic dependency on health care, Missoula ranks 11th. Billings also ranks high at 16th and Great Falls ranks 24th. Missoula, Billings, and Great Falls are the primary centers of health care in Montana with health care sectors considerably larger and more diversified than those in Montana’s other cities.
Health Care Dependency among MSAs Under 160,000 in Montana, Surrounding States, and the West MSAs under 160,000 population located in Montana, Washington, Oregon, Idaho, Wyoming, Utah, Colorado, Arizona, New Mexico, Kansas, Nebraska, South Dakota, North Dakota, and Minnesota were then rank ordered in terms of their dependencies on health care as a source of area labor earnings. Missoula ranks 1st among all of these within this region of the West with $2.43 million in area labor earnings from health care services for every $20 million in area personal income. Bismarck, ND, ranks 2nd followed by Billings at 3rd with $2.32 million. Great Falls is 4th at $2.21 million.
Montana Population by Age, 1990 vs. 2000 The upper chart shows the number of persons residing in Montana by single age from youngest to oldest in 1990 and ten years later in 2000. The lower chart shows how population changed for each age during this ten-year period. Most of the state’s population growth during the ‘90s was among persons at ages between their early 40s and late 50s – classic “baby boomers” or persons born between 1947 and 1963. Some population growth also concentrated among children and young adults between the ages of 12 and 25. This latter group is the children of baby boomers or the boomer “Echo” population. Considerable population decline actually occurred for persons at ages between the boomer group and echo group. There also was a fall-off in population for young children. These “ripples” or “waves” in the population age profile will continue to play out in the future.
Projected Shifts in the Population of Montana by Age The upper chart shows how population changed in Montana by single age from youngest to oldest between 1990 and 2000. The lower chart shows how population is projected to change by the U.S. Census Bureau (March, 2005, projections) between 2000 and 2010. The growth in population that was concentrated among persons between their early 40s and late 50s in the ‘90s is projected to be concentrated between persons in their early 50s to late 60s in the current decade. The echo population also will continue to age, shifting growth to persons between their early 20s and mid-30s. And during the current decade the “echo-echo” population will come into being, reflected in the recent increase in births.
Projected Popu-lation Growth by Age in the Next Decade – 2010 to 2020 The chart at the right shows how Montana’s population is projected to change by age between 2010 and 2020. During the next decade growth in the state’s population will shift to persons in their early 60s to late 70s and Montana is in fact projected to have one of the largest populations 65 and older as a percent of its total by 2020. The echo group or the children of boomers is shown in growth among persons from their early 30s to mid 40s. However, this echo group is projected by the Census Bureau to be much smaller than the boomer group. In turn, the “echo-echo” group is projected to be much smaller than the echo group. As we look out in front of us, we can see that population growth will continue to manifest itself in ripples and waves, with each successive wave of growth smaller than its immediate predecessor. This pattern of growth has significant implications. The fastest growth will occur among seniors and health care demand will continue to rise and housing needs will change. The number of persons at will move up and down at ages where college students are primarily drawn, as well as for high schools and elementary schools. The labor force of Montana will very likely shrink in size in the future as more and more persons leave the workforce for retirement and there are not enough persons entering the workforce to replace them.
Future Pop. Change in Montana by Age Grouping The projected aging of Montana’s population over the next 20 years can be viewed by examining how the population is expected to change by age grouping. The upper chart shows the population under 18 (high school and younger), the population 18 to 33 (young post-high school adults and those at ages of family formation and childrearing), the population 34 to 49 (young and middle-age adults), the population 50 to 64 (older adults at pre-retirement ages), and the population 65 and older. The under 18 population, which grew by only 3% in the ‘90s, is projected to fall by 8% between 2000 and 2010, then grow slightly in the subsequent two decades. The young adult population, which saw very little change in the last decade, would grow by 10% in the current decade before declining in each of the subsequent periods. The older adult working age population between 50 and 64, which saw massive growth in the ‘90s will also see very high growth in the current period before beginning a decline. And the 65 and older population, which grew by only 13% in the ‘90s, will grow by 20%, 46%, and 27% in the subsequent three decades. As a result of these age shifts, Montana will have one of the largest populations over 65 of any state in the country in future years.
Trends in Births-Deaths in Montana – West vs. East The upper chart shows total births and deaths each year in the western mountain region of Montana since the late ‘70s. The lower chart shows the same for counties in eastern Montana. Birth totals in the west have recovered to levels in the early ‘80s. However, in the east, total births have risen modestly but are well below levels in the early ‘80s when the current “echo” age group was being born. The difference between births and deaths is what is called “natural change” and western Montana is currently adding more and more people through natural change as the “echo-echo” group is being born. This should continue for a few more years. And as births eventually begin to decline, deaths will continue rising.
Patterns of Population Change in Missoula Co. by Age While patterns of overall population growth have shifted and changed from period to period, making them difficult to predict, patterns of change by age are particularly complex. The chart at the right shows the total estimated population over time in Missoula County by 10-year age groupings. The area’s youngest populations – those under 10 and between 10 and 19 – are shown in “blue”. Young adults in their 20s are shown in “green”, middle age adults are shown in “red”, older adults are then shown in various shades of “orange” and “gold”. These data are compiled by the U.S. Census Bureau and reflect the population of each age group on July 1 of each year. It can be seen that for many age groups there are “waves” or ripples occurring in their numbers with them rising for a time before falling, only to rise again. These ups and downs occur over periods of ten to fifteen years.
Missoula County Population by Age, Past and Projected Progression ratios were calculated for each 5-year age group contained in the U.S. Census Bureau’s data on population by age in Missoula County. These ratios were then applied to carry these estimates forward into the future. The result is shown in the chart at the right with the estimated population of each 10-year age grouping projected to 2030. The same color codes are used for the various age segments with population under 20 shown in “blue” and young adults in their 20s shown in “green” and so forth. The waves in the population between 20 and 24 can be clearly seen, with an early peak in this group occurring in the late ‘70s and early ‘80s. This peak coincided with the ages of many baby boomers during this time.
Overall Population Growth in Missoula County – Past and Projected based upon Aging Patterns Population change in future years was projected one 5-year age group at a time. These projections were used to arrive upon a statistical formula for predicting future births by Missoula Co. residents. The upper chart shows how these sum into overall population totals for the county. Population would rise from its current level of about 107,000 to almost 109,000 by 2010 and to over 121,000 by 2020 and over 132,000 by 2030. This reflects a slowing in the pace of growth going forward. The average yearly growth rate during the ‘90s was 1.83%, with growth particularly high in the early and mid ‘90s. Yearly average growth in the current decade is estimated at 1.27%. And yearly average growth in the next two decades is projected at 1.13% and 0.87%, respectively. This slowing in growth is a reflection of population aging.
Past and Projected Change in the Young Adult Population of Missoula County The charts at the right show past and projected numbers of young adults in Missoula County, dating back to 1970 and projected forward through 2030. There were two previous peaks in the 20 to 24 population, the first in 1980 and the second in 2003. The next one is expected to occur sometime after 2030. The last peak in the 25 to 29 population was very recent in 2006. So peaks in both of these age groups in 2003 and 2006, respectively, are accounting for this recent increase in births. Adults in their early and mid-30s also are helping to account for this, but their numbers aren’t expected to peak again until after 2011. As the rise and fall in the number of young adults occurs, so does birth numbers and this is what is reflected in the previous birth projections for Missoula County.
Past and Projected Birth Numbers by Missoula County Residents Past trends in the number of births each year by residents of Missoula County are examined using data by the Montana Vital Statistics Bureau. The chart was constructed showing actual births from 1970 through 2008. These births were then generally projected into the future based upon an analysis of this past pattern and the length of time between peaks and valleys in this pattern using data going back to the early ‘50s. Projections for births statewide by the U.S. Census Bureau also were used. These past and generally projected numbers are shown in blue. A statistical analysis was then done relating birth each year to the county’s young adult population – persons 20 to 24, 25 to 29, 30 to 34, and 35 to 39. This analysis yielded a regression equation treating births as a function of persons in each of these age groups over time and this is used in “predicting” births both in the past and in the future (red). A peak in births occurred in 1980 coinciding with the high year for births by baby boomers living in the county and as these boomers aged the birth count fell, hitting a bottom in 1997. The recent rise in births is now accounting for the rise in the county’s youngest children. However, the current rise in births is expected to peak in around 2011 before declining once again, hitting another bottom sometime between 2025 and 2027.
Past and Projected Patterns of Growth and Change in Missoula County’s Under 20 Population The chart in the upper right shows past and projected numbers of persons in the county historically for the period from 1970 to 2008 and as projected into the future through 2030. The lower chart shows the same estimates for persons between 10 and 20. The data used here are 5-year age groupings rather than 10-year groupings. The under 5 population hit a peak in 1985 before falling back to a low in 1999, but has been rising since and is expected to continue doing so through 2014, which will refill the pipeline of young children into the school system. The population 5 to 9 peaked in 1993 before falling to a low in 2003. It is expected to peak again in 2019. Children at ages between 10 and 14 hit a peak in 1997, but their decline is expected to end in about 2009 before rising again throughout the next decade.
Past and Projected MCPS School Enrollment Levels – Elementary, Middle School, and High School These grade level enrollment levels and projections are combined to show how overall enrollment at each of the three major school types with MCPS are expected to change going into the future. The upper chart shows levels for each since 1990 through 2008 and as projected through 2030. Elementary school enrollment fell from a peak in 1991 at 3,871 to a low of 3,186 in 2008 – a decline of 685 students. This is expected to climb back to nearly 3,900 in 2017 and then begin a gradual decline before leveling out sometime after 2030. Middle school enrollment, which peaked at 1,986 students in 1994, will fall to about 1,474 by 2010, and then rise back again to around 1,860 students around 2023. High school enrollment, which hit a peak in 2001 at 4,098 students, will continue to fall to a level of about 3,340 in 2014 before rising again to a level of about 4,160 in around 2026.
Past and Projected Change in the Middle Age Adult Population of Missoula Co. The charts at the right show past and projected numbers of adults in Missoula County who are in their 40s and 50s, dating back to 1970 and as projected through 2030. The top chart shows persons 40 to 44 and 45 to 49. The bottom one shows persons 50 to 54 and 55 to 59. Those 40 to 44 last peaked in ’96 after increasing rapidly in the ‘80s and early ‘90s. Those 45 to 49 peaked in 2003 also after large increases. Growth then flattened for both these groups of 40-year olds, but will rise again in the next two decades. The number of persons in their 50s (lower chart) have been rising and will continue to do so for a few more years before peaking and then declining for a time before rising again.
Past and Projected Change in Older Age Adults in Missoula Co. The charts at the right show past and projected numbers of adults in Missoula County in their 60s and 70s, dating back to 1970 and as projected through 2030. The top chart shows adults 60 to 64 and 65 to 69 and the bottom one shows adults 70 to 74 and 75 to 79. Beginning around 2000 and 2001, sharp increases are now occurring in the number of persons in the 60s and this precipitous rise will continue through the next decade. The number of persons in their early 50s will rise from about 3,000 to over 8,000 by around 2018. Those in their late 50s will rise from less than 3,000 to almost 8,000 by 2023. This same pattern of growth will occur with persons in their 70s, but later in time with their growth sharply increasing in only a few more years and rising into the latter part of the decade after next. The numbers of persons both at ages from 70 to 74 and 75 to 79 will increase from around 2,000 to nearly 7,000 each.
Persons 80 and Older in Missoula Co. – Past and Projected The very oldest segment of the area’s population – those 80 and older – has been relatively small in number throughout much of the area’s past. Those 80 to 84 and 85 and older both numbered less than 1,000 as recently as the late ‘80s. They had both grown to around 1,500 by 2000 and will continue at this level until about the middle of the next decade or around 2016. At this time they will begin to increase in numbers much more rapidly than in the past. Roughly between 2016 and 2030 the number of persons in the county between the ages of 80 and 84 will rise from around 1,600 to over 4,600, an increase of 3,000. And the number of persons 85 and over will rise from roughly 1,600 in 2020 to over 3,800 by 2030.
Change in Population by Age in Missoula County for 10-Year Periods, Past and Projected The chart at the right translates these annual estimates of population change by age into changes that have occurred in the past and can be expected to occur in the future, under these projections. In the ‘90s the 10-year age groups growing by the most in Missoula County were persons in their 40s and 50s, which were “baby boomers”. Both of these groups increased in numbers by more than 4,000 persons. In that boomers currently are mainly in their 50s and 60s, this is translating into disproportionate growth in these age groups in the current decade and will translate into disproportionate growth among persons in their 60s and 70s in the next decade.
Missoula’s Emerging Health Care Cluster Major Hospitals St. Patrick Hospital & Health Sciences Center and Community Medical Center Affiliates – Big Sky Surgery Center, Providence Surgery Center, Montana Neuroscience Institute, International Heart Institute, Montana Cancer Center, Advanced Imaging, Broadway Imaging, Women’s Health Center, etc. Major Providers of Health Care Related Technical Services Missoula Radiology, Missoula Anesthesiology, etc. Ambulatory Health Care Services Western Montana Clinic, Missoula Bone & Joint, Northern Rockies Orthopedics, Rocky Mountain Optical Center, and the many other doctor and dentist offices throughout the community Nursing Homes and Residential Care Facilities Facilities providing nursing care throughout Missoula that will greatly increase as the population ages Social Assistance Programs assisting in Community Health