Download
1 / 7
70 likes | 196 Views
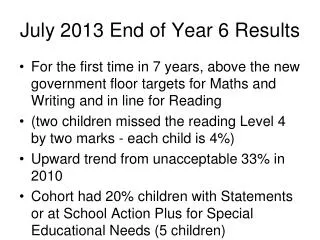
July 2013 End of Year 6 Results. For the first time in 7 years, above the new government floor targets for Maths and Writing and in line for Reading (two children missed the reading Level 4 by two marks - each child is 4%) Upward trend from unacceptable 33% in 2010

E N D
July 2013 End of Year 6 Results • For the first time in 7 years, above the new government floor targets for Maths and Writing and in line for Reading • (two children missed the reading Level 4 by two marks - each child is 4%) • Upward trend from unacceptable 33% in 2010 • Cohort had 20% children with Statements or at School Action Plus for Special Educational Needs (5 children)
KS2 Progress • Well above national progress rates (as measured in Average Point Scores) in all year groups for all subjects over 2012-13 • Good progress with the children who have moved from a Level 1 at KS1 to Level 4 at the end of year 6 • Some children have surpassed this moving from a Level 1 to a Level 5 at the end of year 6 – outstanding progress
Average Progress data in APS throughout the school over 2 ½ terms (October-July 2013)Traditional National Progress is 1.3 points per term in KS1 (3.25 for 2 ½ terms); 1 point per term in KS2 (2.5 for 2 ½ terms)New progress measure 16 APS over KS2 = 4 APS a year=1.3 APS a term (3.25 for 2 ½ terms)
Projected Year 6 results 2014 onwardsred=interventions in place
KS1 results breakdown 2013% in green is for stable cohort of 17one child is 5% 5 children joined the cohort during the Autumn term 2012