Sustainable Management of Municipal Solid Waste Treatment: A Comparative Study in Orleans
This study focuses on the management and treatment of municipal solid waste in Orleans, integrating experimental data from local municipalities and private companies to create a comprehensive simulator reflecting the waste management system of 2002. Key steps include data collection, identification of inconsistencies, and flow analysis of various waste streams, such as incineration, composting, and recycling. Scenarios for waste generation projections in 2003 support the development of a more efficient and sustainable waste treatment approach.

Sustainable Management of Municipal Solid Waste Treatment: A Comparative Study in Orleans
E N D
Presentation Transcript
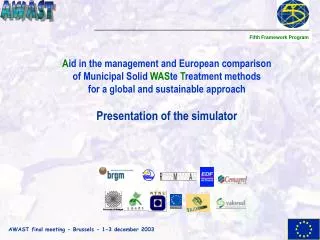
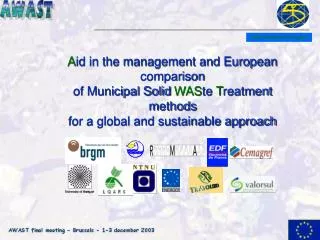
Fifth Framework Program Aid in the management and European comparisonof Municipal Solid WASte Treatment methodsfor a global and sustainable approachOrleansCase Study
Steps 1 & 2: basic experimental data • Data collection • From municipalities • From private companies manager of treatment plant • Data treatment • Identification of inconsistencies (definition of streams, definition of waste, dates,…) • Identification of uncoherence (in - out 0) • Collection of missing data • Awast default values • Statistical bases Results: flowsheet and streams data = 8 meetings
Chevilly 15 km Change 220 km St Peravy 45 km Lorris 55 km Incineration MBT Composting Sorting Landfill 10 km Chaingy 10 km Meziere 20 km Orleans flowsheet 280 000 inhabitants 22 municipalities
Data collected used for simulator build-up Treatment plants • Collection: • Flowrate of waste collected • Calibration of collection process based on 2003 6 first months • Sorting: products sold & total input • Landfill: operator annual report 2002 • Transport: kms • Incineration: AGGLO annual report 2002 • Mechanical and biological treatment plant: most data extracted from Tratolixo simulator (database) and models adjusted with annual report 2002 data • Other composting plants Database biowaste plants
Steps 3 & 4: simulator build-up Results: the data available allows to make a complete simulator of the actual situation in 2002
Global Orléans 2002 Bulky waste 15793 Hazardous 281 Oil-fat 107 Ferrous Metal 3172 Glass 6458 Direct Recycling 25811 t/y Bulky waste 4268 t/y Wood 4889 t/y Paper-cardboard 10178 t/y Bulky waste 1520 Mixed second 13480 Recycl. fract 11751 Paper 748 Sorting Plants 27499 t/y Plastics 1166 t/y Metals 2149 t/y Composite pack 143 t/y 1791 t/y Residues 2914 t/y COLLECTION Incineration Plant 100113 t/y Mixed waste 17913 Therm. Fract 75695 Oil-fat 163 Scrap 2689 t/y Bottom ash 18814 t/y Heavy 3429 t/y Org waste 3908 Biowaste 15263 Mixed waste 945 Biol Fraction 4181 Scrap 45 t/y Composting Plants 24298 t/y Compost 9456 t/y Compost residues 6446 t/y Ash - Filter cake 1695 t/y Road waste 9589 Bulky waste 16117 Mixed waste 46307 Org. waste 2987 Landfill 78487 t/y
Step 5: simulation of scenarios Scenarios • Scenario 0: Assessment of the waste management system in 2003 • Scenario 1: New collection of biowaste and composting
Scenario 0 - approach • Calculation of waste generated in 2003 • Modelling of the new collection system implemented in 2003 • Calculation of collected flows, collection performance, energy and costs • Simulation of waste management system in 2003
Study of the waste generation in 2002 • Determination of the first six months ratio compared to the entire year for 2002 • Estimation of the waste generation for the whole year 2003 based on: • The 2002 ratio applied on the 2003 January-June data • Assumptions for unknown streams Scenario 0 - Waste generation in 2003 • Available 2003 data: • Data for the first half of the year (January-June 2003) for some waste streams • Source: Municipality • The need: • Data for the entire year!
Scenario 0 - Waste generated Others waste generated: Waste generated per inhabitants: 346 Kg per inhab. per year
Scenario 0 - Simulation of collection in 2003 5 areas for curbside collection Collection of mixed waste Separate waste collection - Curbside
Scenario 0 - Simulation of collection in 2003 • Social aspect: • 216 employees for collection • 24 others • Energy aspect: 15 880 325 MJ=449 231 liters of diesel • Environment: 948 326 kms driven with • Cost aspect: 44 euros per inhabitants
Global Orléans 2003 without biowaste collection Bulky waste 16626 Hazardous 296 Oil-fat 113 Ferr. Metal 3339 Glass 7325 Direct Recycling 27699 t/y 100% Bulky waste 4208 t/y Wood 4889 t/y 12% Paper-cardboard 11993 t/y Bulky waste 1450 Mixed second 13480 Recycl. fract 14056 Paper 735 Sorting Plants 29721 t/y Plastics 832 t/y Metals 2121 t/y Composite pack 159 t/y 1781 t/y Residues 3737 t/y COLLECTION 38% Incineration Plant 104503 t/y Mixed waste 22494 Therm. Fract 74763 Oil-fat 125 Scrap 2825 t/y Bottom ash 19940 t/y Heavy 3384 t/y 10% Org waste 3909 Biowaste 15887 Mixed waste 930 Biol Fraction 4130 Scrap 45 t/y Composting Plants 24856 t/y Compost 9724 t/y Compost residues 6663 t/y Ash - Filter cake 1819 t/y Road waste 9590 Bulky waste 16967 Mixed waste 46307 Org. waste 2987 Landfill 79451 t/y 30% 11%
Global Orléans 2003 without biowaste collection - Cost Additional cost 4,176,670 € 35% 100% 8% 988 835 € Direct Recycling Bulky waste 15% Wood Paper-cardboard 21% 2,542,473 € Sorting Plants 3,757,391 € Plastics Metals Composite pack COLLECTION 12,024,716 € Residues 32% Incineration Plant 3,096,445 € 3, 823,979 € Scrap Bottom ash 12% Heavy 3% 322,797 € Scrap Composting Plants 744,880 € Compost Compost residues 3% Ash - Filter cake 1% 169,963 € Landfill 6,231,765 € 47% 24%
Global Orléans 2003 without biowaste collection - Energy Direct Recycling Collection 2,737,423 MJ Bulky waste Wood Paper-cardboard Collection 4,899,864 MJ Transport 216,979 MJ Sorting Plants Plastics Transport 2,874,772 MJ Metals Composite pack Residues COLLECTION TRANSPORT 15,880,325 MJ 1,166,339 MJ Incineration Plant - 182,341,152 MJ + 31,977,300 MJ Collection 6,257,852 MJ Transport 240,966 MJ Scrap Transport 1,328,191 MJ Bottom ash Heavy Collection 1,521,906 MJ Transport 77,629 MJ Scrap Composting Plants Transport 109,585 MJ Compost Compost residues Ash - Filter cake Collection 463,226 MJ Transport 625,165 MJ Landfill-28,980,880 MJ
Scenario 0 - simulation results • Multi-criteria assessment: • Matter balance • Cost balance • Energy balance • Emissions to environment
Scenario 0 - simulation results % Matter recovery: 25.2% • Compost: 3.8% • +7.8% bottom ashes % Waste in landfill: 33.7% • Matter balance: 255 506 tons • Imported waste: 32% • Total waste from Orleans: • 634 kg/inhab.year • Cost balance: • 25 855 197 € = 101 €/ton • Energy balance: • Consumption = 53 336 512 MJ • 209 MJ/ton • Production = 211 322 032 MJ • 827 MJ/ton
Global Orléans 2003 without biowaste collection - Paper 0.1% Bulky waste 0 Hazardous 0 Oil-fat 0 Ferrous Metal 33.5 Glass 1.5 Direct Recycling 35 t/y Bulky waste 0 t/y Wood 0 t/y 25.9% Paper-cardboard 11993 t/y Bulky waste 0 Mixed second 2130 Recycl. fract 10866 Paper 665 Sorting Plants 13661 t/y Plastics 0 t/y Metals 0 t/y Composite pack 0 t/y 213 t/y Residues 1455 t/y COLLECTION 49.3% Incineration Plant 25968 t/y Mixed waste 5123 Therm. Fract 18691 Oil-fat 0 Scrap 0 t/y Bottom ash 208 t/y Heavy 699 t/y 3.1% Org waste 53 Biowaste 318 Mixed waste 233 Biol Fraction 1032 Scrap 0 t/y Composting Plants 1636 t/y Compost 82 t/y Compost residues 133 t/y Ash - Filter cake 0 t/y Road waste 3356 Bulky waste 0 Mixed waste 7792 Org. waste 0 Landfill 11361 t/y 21.6%
Global Orléans 2003 without biowaste collection - Pb 11.9% Bulky waste 7.5 Hazardous 0.3 Oil-fat 0 Ferrous Metal 0.7 Glass 2.9 Direct Recycling 11.4 t/y 100% Bulky waste 2.8 t/y Wood 0.2 t/y 10.3% Paper-cardboard 0.9 t/y Bulky waste 0.6 Mixed second 6.6 Recycl. fract 2.5 Paper 0.1 Sorting Plants 9.8 t/y Plastics 0.3 t/y Metals 3.5 t/y Composite pack 0.1 t/y 0.6 t/y Residues 1.4 t/y COLLECTION 35.4% Incineration Plant 33.9 t/y Mixed waste 8 Therm. Fract 23.3 Oil-fat 0 Scrap 1 t/y Bottom ash 29.4 t/y Heavy 1.2 t/y Org waste 0.9 Biowaste 1.7 Mixed waste 0.3 Biol Fraction 1.3 4.4% Scrap 0.008 t/y Composting Plants 4.2 t/y Compost 2.1 t/y Compost residues 0.8 t/y Ash - Filter cake 3.5 t/y Road waste 2.8 Bulky waste 7.6 Mixed waste 21.8 Org. waste 0.1 Disposal 36.4 t/y 38.0%
Scenario 1 • New collection of biowaste • Closing of MBT plant (composting of mixed waste) • Redirecting mixed waste to incineration • Composting of biowaste in Meziere plant
Scenario 1 - collection New collection of biowaste • Hypothesis • 60 kg/inhab.year • Frequency: once per week • One crew per day • Results • For biowaste collection • 11 vehicles • 48 employees for collection • 6 employees: manager and secretary • Performance: 0,8 tons per loader per working hour • 21€ per ton for containers purchasing • 110 € per tons (vehicles and labour) 7.6 € per inhabitants for the biowaste collection Additive cost (scenario 1/scenario 0) = 11.2€ per inhabitants
Global Orléans 2003 with biowaste collection 11% Bulky waste 16626 Hazardous 296 Oil-fat 113 Ferrous Metal 3339 Glass 7325 Direct Recycling 27699 t/y 100% Bulky waste 4208 t/y Wood 4889 t/y 12% Paper-cardboard 11993 t/y Bulky waste 1450 Mixed second 13480 Recycl. fract 14055 Paper 736 Sorting Plants 29721 t/y Plastics 832 t/y Metals 2121 t/y Composite pack 159 t/y 1781 t/y Residues 3737 t/y COLLECTION 34% Incineration Plant 89750 t/y Mixed waste 23424 Therm. Fract 62464 Oil-fat 125 Scrap 2758 t/y Bottom ash 18675 t/y Heavy 0.5 t/y 14% Org waste 3909 Biowaste 32314 Mixed waste 0 Biol Fraction 1 Scrap 0 t/y Composting Plants 36224 t/y Compost 19638 t/y Compost residues 12378 t/y Ash - Filter cake 1619 t/y Road waste 9590 Bulky waste 16967 Mixed waste 46307 Org. waste 2987 Landfill 79251 t/y 30%
Global Orléans 2003 with biowaste collection - Cost Additional cost 5,092,768 € 988,835 € Direct Recycling Bulky waste Wood Paper-cardboard 2,534,756 € Sorting Plants 3,757,391 € Plastics Metals Composite pack COLLECTION 15,081,289 € Residues Incineration Plant 2,919,685 € 4, 027,781 € Scrap Bottom ash Heavy 2,267,186 € Scrap Composting Plants 1,043,671 € Compost Compost residues Ash - Filter cake 169,963 € Landfill 6,231,765 €
Global Orléans 2003 with biowaste collection - Energy Direct Recycling Collection 2,737,423 MJ Bulky waste Wood Paper-cardboard Collection 4,899,864 MJ Transport 216,978 MJ Sorting Plants Plastics Transport 2,874,772 MJ Metals Composite pack Residues COLLECTION TRANSPORT 18,898,993 MJ 1,155,583 MJ Incineration Plant - 170,813,170 MJ + 27,463,170 MJ Collection 6,007,914 MJ Transport 250,829 MJ Scrap Transport 1,252,906 MJ Bottom ash Heavy Collection 4,790,556 MJ Transport 62,611 MJ Scrap Composting Plants Transport 217,756 MJ Compost Compost residues Ash - Filter cake Collection 463,226 MJ Transport 625,165 MJ Disposal- 28,980,880 MJ
Scenario 1 compared to Scenario 0 • Waste treatment: • Thermal treatment: -4.4% of waste input • -12% of waste thermally treated • Biological treatment: +4.4% of waste input • +46% of waste biologically treated • Matter balance: • % Matter recovery: 29.1%(+3.8%) • % Residues: 35.9%(-2.2%) • Cost balance:+3 178 604 € • +12% • +11.6 € per inhabitants • Energy balance: • -1 473 332 MJ consummed (-3%) • -11 527 982 MJ produced (-5%) • Social aspect: +54 employees for the new collection