Trace Gas Dispersion Analysis
Trace Gas Dispersion Analysis. XAVIER DRIVER THOMAS A. ABE RICHARD DEANE Fort Berthold Community College New Town, ND 58763. Introduction.

Trace Gas Dispersion Analysis
E N D
Presentation Transcript
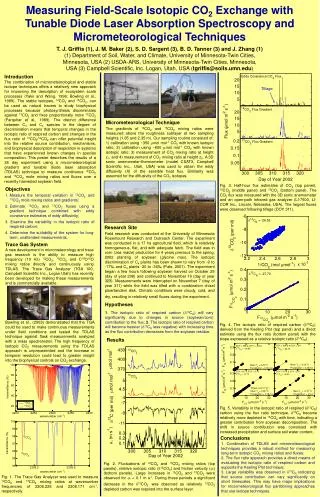
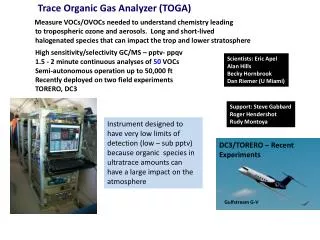
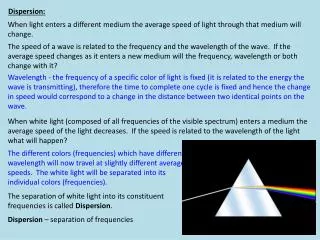
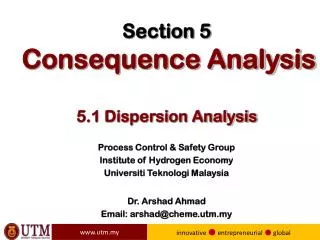
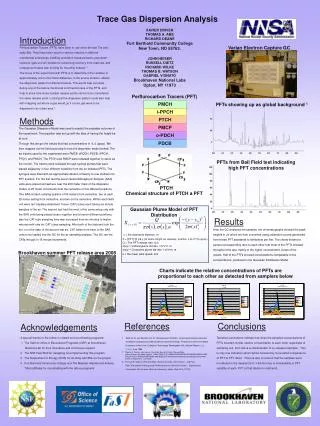
Trace Gas Dispersion Analysis XAVIER DRIVER THOMAS A. ABE RICHARD DEANE Fort Berthold Community College New Town, ND 58763. Introduction Perflurocarbon Tracers (PFTs) have been in use since the late 70s and early 80s. They have been used for various reasons in different commercial enterprises, building ventilation measurements, petroleum reservoir (gas and oil) studies for enhancing recovery from reserves, and underground cable leak hunting for the utility industry. 1 The focus of the experiment with PFTs is to determine if the variation in approximately one to five meter distances, in the source location, affects the dispersion pattern for different tracers. This would help cut costs during any of the before mentioned commercial uses of the PFTs, and help to show how close multiple release points can be to be considered the same release point. Looking at the dispersion pattern could also help with mapping out where a gas would go if a toxic gas were to be dispersed in an urban area.2 Varian Electron Capture GC JOHN HEISER RUSSELL DIETZ RICHARD WILKE THOMAS B. WATSON GABRIEL VIGNATO Brookhaven National Labs Upton, NY 11973 Perflurocarbon Tracers (PFT) PFTs showing up as global background 1 Methods The Gaussian Dispersion Model was used to predict the probable outcome of the experiment. The equation was set up with the idea of having the height be at zero. Through this we got the values that had concentrations in fL/L (ppqv). We then mapped out the field according to how the dispersion model looked. The six tracers used for the experiment were PMCP, oPDCH, PDCB, iPPCH, PTCH, and PMCH. The PTCH and PMCP were released together to serve as the control. The tracers were released through syringe pumps that were placed adjacently in four different locations from the co-released PFTs. The syringes were filled with an approximate dilution of twenty to one methanol to PFT solution. For the first test the seven Serial Atmospheric Sampler (SAS) units were placed somewhere near the 200 meter mark of the dispersion model, at 25 meter increments from the centerline in five different positions. One SAS at each outlying position of 50 meters from centerline, two at each 25 meter setting from centerline, and two on the centerline. Within each SAS unit were ten Capillary Adsorbent Tracer (CAT) tubes each taking six minute samples of the air. The second test had the most of the same setup only with the SAS units being placed closer together and at seven different positions, also the CAT tube sampling time was increased from six minutes to twelve minutes with only six CAT tubes sampling. After both of the tests we took the ten, or in the case of the second test six, CAT tubes from each of the SAS units to be loaded into the GC for the air sampling analysis. The GC ran the CATs through in 15 minute increments. PFTs from Ball Field test indicating high PFT concentrations PTCH Chemical structure of PTCH a PFT Gaussian Plume Model of PFT Distribution Results After the GC analyzed the samples, the chromatographs showed the peak heights in mV which we then converted using calibration curves generated from mixed PFT standards to femtoliters per liter. The charts showed a general corresponding ratio to each other that most of the PFTs followed throughout the test, mainly in the higher concentration zones of the results. Half of the PTFs showed concentrations comparable to the concentrations predicted in the Gaussian Distribution Model. x = the downwind distance, m X = [PFT] @ p& y (at same height as release), position x pL/m^3(=ppqv) Q = The PFT release rate, fL/s σ(x)z = Vertical plume std dev: = b*x^n, m σ(x)y = Crosswind plume std dev: = a*x^m, m Brookhaven summer PFT release area 2008 ū = the mean wind speed, m/s Charts indicate the relative concentrations of PFTs are proportional to each other as detected from samplers below References Conclusions Acknowledgements • A special thanks to the follow in related and coordinating programs: • 1 The Staff at Office of Educational Programs (OEP) at Brookhaven • National Lab for their innovative and continuous support • 2 The NSF Fast Staff for designing and implementing this program • The Department of Energy (DOE) for working with BNL on the project • Fort Berthold Community College and The Mandan Hidatsa and Arikara Tribal affiliates for coordinating with the above programs Tentative conclusions indicate that since the sampled concentrations of PFTs maintain similar relative concentration to each other regardless of sampling unit, then this is a characteristic of co-released samples. This is only one indication which will be followed by more detail comparisons of PFT to PFT ratios. There is also a concern that the samples were not diluted to the desired 20 to 1 dilution due to immiscibility or PFT volatility of each PFT at that dilution in methanol. 1 Dietz, R. N. and Goodrich, R. W. “Measurement of HVAC system performance and local ventilation using passive perfluorocarbon tracer technology”. Prepared in part for the State University of New York, College of Technology, Farmingdale, NY. Informal Report, BNL-61990, June 1995 2 Thomas B. Watson, John Heiser, Paul Kalb, Russell N. Dietz, Richard Wilke, Robert Wieser, and Gabe Vignato, “ NEW YORK CITY URBAN DISPERSION PROGRAM MARCH 2005 FIELD STUDY: TRACER METHODS AND RESULTS”, Brookhaven National Laboratory,Environmental Sciences Department June 2006 3 Thomas B. Watson, Richard Wilke, Russell N. Dietz, John Hieser, and Paul Kalb,”Atmospheric Background Perfluorocarbons Used As Tracers” , Supplimental Information, Brookhaven National Laboratory, Upton, New York, 11973