Download
1 / 1
20 likes | 102 Views
Dr. Antonio Aguirre leads the development of a Fourier transform spectrometer using miniature waveguides in NYC College of Technology. The project aims to reduce costs and size while improving performance for planetary exploration.

E N D
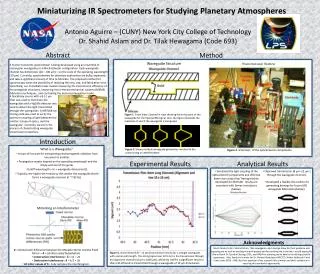
Miniaturizing IR Spectrometers for Studying Planetary Atmospheres Antonio Aguirre – (CUNY) New York City College of Technology Dr. ShahidAslam and Dr. TilakHewagama (Code 693) Method Abstract Transmission Testing Waveguide Structure A Fourier transform spectrometer is being developed using an ensemble of rectangular waveguides in a Mach-Zehnder configuration. Each waveguide channel has dimensions (10 – 100 μm) – on the scale of the operating wavelength (10 μm). Currently, spectrometers for planetary exploration are bulky, expensive, and take a significant amount of time to fabricate. The proposed method for spectroscopy bares the possibility of reducing the cost, size, and fabrication time. Specifically, our immediate tasks involve measuring the transmission efficiency of the waveguide structures, improving micro-electromechanical systems (MEMS) fabrication techniques, and controlling the desired propagation mode. Mimicking an Interferometer Focusing Beam Detector Waveguide Blackbody Beam Collimator Beam Collimator A blackbody source with a 8-12 μm filter was used to illuminate the waveguides and a HgCdTe detector was used to detect the light transmitted through the waveguides. A MATLAB ray tracing code was used to verify the optimum coupling of light between the emitter, transport optics, and the waveguide. Currently, we are in the process of characterizing waveguide transmission properties. Focusing Beam 8 μm – 12 μm Filter • d = Optical path difference between the Movable Mirror and the Fixed Mirror = δ = 2d (Also called Retardation) • Constructive Interference :δ = nλ = 2d • Destructive Interference : δ= λ/2 = 2d • All other values of δ : Fully samples the interferogram. Figure 1. Front View: Zoomed in view showing the entry point of the waveguide for the injected EM signal. Also, the figure illustrates the materials of which the waveguide is composed. Introduction Figure 2. Shows multiple waveguide geometries involved in the constructing an interferometer. Figure 3. Schematic of the optical bench components. What is a Waveguide? • A type of line pipe for transporting electromagnetic radiationfrom one point to another. • Propagation modes depend on the operating wavelength and the shape and size of the guide. (Cutoff wavelength = λc ≈ waveguide dimension/2) • Typically, the higher the frequency the smaller the waveguide (Earth forms a waveguide resonant at ~7.83 Hz). Analytical Results Experimental Results • Simulated the light coupling of the optical bench components and effective beam size using a Ray Tracing module developed for MATLAB: results are consistent with Zemax simulations (below). • Observed transmission (8 μm–12 μm ) through the waveguide channels. • Developed a flexible IDL module for generating bitmaps for future MZI waveguide fabrication (below). Acknowledgments Much thanks to Drs. ShahidAslam, TilakHewagama, and George Shaw for their guidance and exposing me to such an exciting research project and for assisting me in the lab. I would especially like to thank Dr. Cynthia Cheung, LPSA, and NASA for allowing me to have an enriching scientific experience. Also, thanks is in order for Dr. Viviana Vladutescu (NYCCT), Arthur Sedlacek III and Ernie Lewis (DOE – BNL) for their approval of my research this summer and their assistance in securing this wonderful opportunity. Figure 4. Initial infrared (8 – 12 μm) transmission results for a straight waveguide with a 6mm path length. The strong signal near 42.5 mm is the transmission through the alignment channel (10μm x 1000 μm), which by itself is a significant result in that mid-infrared is transmitted through a waveguide of 10 μm dimensions.


