Download
1 / 19
200 likes | 429 Views
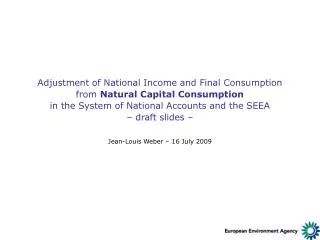
Adjustment of National Income and Final Consumption from Natural Capital Consumption in the System of National Accounts and the SEEA – draft slides –. Jean-Louis Weber – 16 July 2009. The issue. Accounting norms on the G20’s agenda fair calculation of results, performances, and risks

E N D
Adjustment of National Income and Final Consumption from Natural Capital Consumptionin the System of National Accounts and the SEEA – draft slides – Jean-Louis Weber – 16 July 2009
The issue • Accounting norms on the G20’s agenda fair calculation of results, performances, and risks • National accounts (UN SNA 2008) still don’t record natural capital consumption when calculating National Income (although it is defined as Gross National Product minus Capital Consumption) and when measuring Final Consumption (on the basis of direct purchasers’ prices, no consideration for indirect costs caused within the country or abroad via imports) • Consequences are very insufficient macro-economic indicators (little visibility of risks – see G20; little visibility of accumulated ecological debts; a high policy concern – see Beyond GDP Conference or work of the Stiglitz Commission; risk that the Green Economy will never happen) • It is time for introducing correctly nature into national accounts – even with coarse measurements; because of risks of “leakage” from well towards less protected countries, the adjustments have to be implemented worldwide • It is possible to start NOW calculating these adjustments on the basis of global monitoring and international statistics and improve the system in a second step alongside UN SEEA revision by 2012/2013. • NEXT: Illustration of simplified methodology in the case of inland ecosystems
Key features of simplified ecosystem accounts / SEEA - SNA • Natural assets accounts [in physical units only] • Ecosystem assets (stocks and health, change in total ecological potential) • Sub-soil assets (stocks and lifetime, physical depletion) • Consumption of Natural Capital [in physical & monetary units] • Ecosystem Capital Consumption (domestic) = ECC (domestic) • Virtual Transfers of Ecosystem Capital concealed in imports = VTEC (imports) • Depletion User Cost of Domestic Non Renewable Assets (El Serafy method) = DUC (domestic) • Domestic Natural Capital Consumption = ECC (domestic) + DUC (domestic) • Environmental Debts (or Liabilities) = ECC (domestic) + VTEC (imports) • Full Cost of Goods and Services (FCGS) • Full Cost of Goods and Services = Commodities at market price + ECC (domestic) + VTEC (imports) • [NB.: depletion user costs being part of market price, no addition is needed] • Adjusted Disposable National Income (ADNI) as SNA headline aggregate • ADNI = conventional National Income – Natural Capital Consumption • [conform to the Stiglitz/Sen/Fitoussi proposal] • Adjusted Net Savings are derived automatically from ADNI (WB “Genuine Savings” with ecosystem capital consumption) • Ecosystem services account [physical units and monetary valuation] • Market and non market services in physical units [tons, volume, surface*people*time,...] • Valuation according to ecosystem service types • Likely to be limited to the most important ecosystem services / sectors • Inclusive Final Consumption (IFC) • Inclusive Final Consumption = conventional SNA Final Consumption + Ecosystem Capital Consumption (domestic) + Virtual Transfers of Ecosystem Capital concealed in imports – Ecosystem Capital Consumption in exports
Simplified Ecosystem Accounts & National Accounts Adjustment Consumption of Ecosystem Capital & Adjustments of National Accounts for “over-consumption” and/or “under-investment” Virtual Consumption of Ecosystem Capital in Imports Full Cost of Goods & Services Consumption of Domestic Ecosystem Capital Adjusted Disposable National Income Depletion of Sub-soil Assets
Ecosystem Dependency (land, soil, energy, water, N,P,K...) Georges Braque – Harbour in Normandy, 1909 Healthy Populations (human and wildlife) Biodiversity Rarefaction (loss of adaptability) Carbon, Biomass (productivity, biomass diverted from Nature, HANPP) Landscape Ecological Potential (the landscape radiography) Catchments Exergy Loss (from water evaporation & pollution) Simplified Ecosystem Accounts & National Accounts Adjustment: A “Cubist” Approach to Ecosystem Capital [1/3] Total Ecological Potential Total Current Ecological Potential (terrestrial ecosystems) Multi-criteria rating
Simplified Ecosystem Accounts & National Accounts Adjustment:A “Cubist” Approach to Ecosystem Capital [2/3] Change in Total Ecological Potential, Maintenance & Restoration of Ecosystem Capital Total Ecological Potential Time t+1 Total Ecological Potential (terrestrial ecosystems) Time t _ Annual Consumption of Ecosystem Capital (physical index) = Annual Maintenance of Ecosystem Capital + = = Additional Restoration Target Ecological Potential t t+n Annual amortization of historical degradation
Simplified Ecosystem Accounts & National Accounts Adjustment:A “Cubist” Approach to Ecosystem Capital [3/3] Change in Total Ecological Potential, Maintenance & Restoration of Ecosystem Capital Total Ecological Potential Time t+1 Total Ecological Potential (terrestrial ecosystems) Time t _ Annual Consumption of Ecosystem Capital (money) € = Annual Maintenance of Ecosystem Capital + = = Additional Restoration Target Ecological Potential t t+n Annual amortization of historical degradation Valuation of maintenance / restoration costs
Example: making of Landscape Ecological Potential (1/6) Corine land cover map (derived from satellite images) Green Background Landscape Index (derived from CLC) Naturilis (derived from Natura2000 & CDDA) Effective Mesh Size (MEFF, derived from TeleAtlas and CLC) Landscape Ecological Potential (LEP) 2000, by 1km² grid cell LEP 2000 by NUTS 2/3
Example: making of Landscape Ecological Potential (2/6) Corine land cover map (derived from satellite images) Green Background Landscape Index (derived from CLC) Naturilis (derived from Natura2000 & CDDA) Effective Mesh Size (MEFF, derived from TeleAtlas and CLC) Landscape Ecological Potential (LEP) 2000, by 1km² grid cell LEP 2000 by NUTS 2/3
Example: making of Landscape Ecological Potential (3/6) Corine land cover map (derived from satellite images) Green Background Landscape Index (derived from CLC) Naturilis (derived from Natura2000 & CDDA) Effective Mesh Size (MEFF, derived from TeleAtlas and CLC) Landscape Ecological Potential (LEP) 2000, by 1km² grid cell LEP 2000 by NUTS 2/3
Example: making of Landscape Ecological Potential (4/6) Corine land cover map (derived from satellite images) Green Background Landscape Index (derived from CLC) Naturilis (derived from Natura2000 & CDDA) Effective Mesh Size (MEFF, derived from TeleAtlas and CLC) Landscape Ecological Potential (LEP) 2000, by 1km² grid cell LEP 2000 by NUTS 2/3
Example: making of Landscape Ecological Potential (5/6) Corine land cover map (derived from satellite images) Green Background Landscape Index (derived from CLC) Naturilis (derived from Natura2000 & CDDA) Effective Mesh Size (MEFF, derived from TeleAtlas and CLC) Landscape Ecological Potential (LEP) 2000, by 1km² grid cell LEP 2000 by NUTS 2/3
Example: making of Landscape Ecological Potential (6/6) Corine land cover map (derived from satellite images) Green Background Landscape Index (derived from CLC) Naturilis (derived from Natura2000 & CDDA) Effective Mesh Size (MEFF, derived from TeleAtlas and CLC) Landscape Ecological Potential (LEP) 2000, by 1km² grid cell LEP 2000 by NUTS 2/3
LEP, state and change 1990 Change 1990-2000 Landscape Ecological Potential1990-2000, 1km² grid (Source: Ecosystem Accounting for Mediterranean Wetlands, an EEA feasibility study for TEEB) In brown grades, first clues of “ecosystem capital consumption” Which will be validated with other “cube” indicators
LEP, state and change, local scale Natural Park of Camargue (France) 1990 Change 1990-2000 Landscape Ecological Potential1990-2000, 1km² grid (Source: Ecosystem Accounting for Mediterranean Wetlands, an EEA feasibility study for TEEB) In brown grades, first clues of “ecosystem capital consumption” Which will be validated with other “cube” indicators
Ecosystem services values vs. Ecosystem functions maintenance/restoration costs Ecosystem Services values Bottom-Up, Individual preferences, Market and Shadow prices, General equilibrium modelling Ecosystem Stocks & Flows Ecosystem Health Service 1 value Service 1: e.g. timber Service 2 value Service 2: e.g. fish Service 3 value Service 3: e.g. water regulation Service 4 value Service 4: e.g. eco-tourism Service nn value ???? Service 5: e.g. nn Service nnn ???? Land cover Biomass/Carbon Soil Species/populations Water catchments Sea Atmosphere Vigour Organisation Resilience Autonomy Support to healthy populations Consumption of Ecosystem Capital Maintenance/restoration costs Top-Down, Collective preferences, Multi-criteria decision (economic benefits, costs, social values, long term targets…)
Ecosystem services values vs. Ecosystem functions maintenance/restoration costs Ecosystem Services values Bottom-Up, Individual preferences, Market and Shadow prices, General equilibrium modelling Ecosystem Stocks & Flows Ecosystem Health Service 1 value Service 1: e.g. timber Service 2 value Service 2: e.g. fish Service 3 value Service 3: e.g. water regulation Service 4 value Service 4: e.g. eco-tourism Service nn value ???? Service 5: e.g. nn Service nnn ???? Land cover Biomass/Carbon Soil Species/populations Water catchments Sea Atmosphere Vigour Organisation Resilience Autonomy Support to healthy populations Ecological Tax or/and Value of offset certificates (fair use of ecosystems public good) Ecosystem public good protection Maintenance/restoration costs Top-Down, Collective preferences, Multi-criteria decision (economic benefits, costs, social values, long term targets…)
Global scale: International Conventions monitoring Markets framing & regulation Simplified accounts Global trade of ecosystem permits, IPES Programmes assessment (e.g. REDD) International financial standards (for loans…) Contribution to international organisations National & regional government: Environmental agencies, Ministries of economy, Statistical offices, Courts SEEA 2012 Framework Clearing house on [1] ES prices & [2] ecosystem mitigation costs Sector accounts Green taxes Beyond GDP Accounting Action level: Local scale, management, Site level, case studies, Projects, Business Accounting guidelines, norms Impacts assessments, costs & benefits Local government, Agencies assessment Corporate accounting results, rating, trade Markets of specific ecosystem services, PES Scales, accounts, governance
Data needs for a quick start ! – and later on • Inland ecosystems • … (e.g. GlobCorine) • … (e.g. Water assets monitoring) • … (e.g. Biodiversity data) • … (e.g. Soil/Forest carbon/biomass data) • Sea/Oceans • … (e.g. Fisheries) • … (e.g. Coastal water/ spawning areas) • … (e.g. Carbon storage) • Atmosphere • … (e.g. GHGs monitoring) • … (e.g. Climate monitoring) • Socio-economic statistics • … (e.g. population, health, nutrition) • … (e.g. agriculture) • … (e.g. import/exports)