Download
1 / 22
220 likes | 358 Views
Marital Status And Inequality Of Earnings Within The Household. GHS user meeting Thursday 29 March 2007 debora.price@kcl.ac.uk. Inequality of Earnings. Research into the management of household money shows that Household resources are not shared equally

E N D
Marital Status And Inequality Of Earnings Within The Household GHS user meeting Thursday 29 March 2007 debora.price@kcl.ac.uk
Inequality of Earnings • Research into the management of household money shows that • Household resources are not shared equally • Spending differs between men & women (e.g. women spend on children and child care) • Financial inequality is a source of power and conflict within the household • Some financial behaviours are associated with the degree of inequality in a relationship e.g. pension saving • Earnings inequality leads to ‘choices’ in the household division of labour which in turn leads to lower lifetime earning for dependent partners • Earnings inequality becomes especially important when couples separate
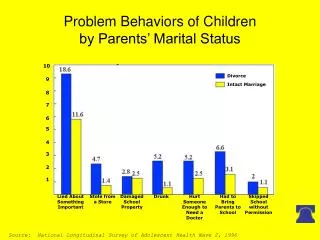
A Question of Gender • Men earn more per hour, and work more hours • Women continue to take on housework and care • ‘Breadwinner’ culture: rare for women in any occupational stratum to earn more than their partner • Families that are dependent on women’s incomes are the poorest
Changing Family Forms • Substantial demographic change in recent decades • Rise in cohabitation and other forms of intimate relationship as an alternative to marriage • Rise in childbirth outside marriage (40% in 2001, compared with 12% in 1980) • Rise in relationship breakdown - separation and divorce • Increase in proportions in the population with complex marital histories
Earnings Inequality and Changing Family Forms • Are those who ‘choose’ not to marry displaying a particular type of independence which implies greater gender equality of earnings? • Issue: regulation of legal marriage to redress gender inequalities in earnings • Maintenance, division of assets & pensions, use of NI contribution record, inheritance rights • Little financial redress after breakdown of cohabitation • Does different marital status of itself imply that earnings inequalities are different? Are cohabitants ‘more equal’ than legally married? • Does this depend on the ages of children? Is this different for younger and older couples?
Data Requirements • Need a dataset that • Has large numbers, sufficient for sub-group analysis. • Collects partner’s data. • Collects maternal and partnership histories • Collects detailed information about earnings
Possible Resources • BHPS – panel drawn in 1991 & represents that population; increasingly, attrition • FRS – large numbers but no marital and maternal histories • LFS – large numbers but no marital and maternal histories • GHS – not perfect (no marital/partnership/ maternal histories from those over 60; no paternal histories); but pretty good all round • ELSA – possible future resource (histories being collected), but only those over 50
GHS Data • Combined two years: 2000/1 and 2001/2 • Aged 20 to 59: women: n=11,087; men: n=10,314 • Partnered, aged 20 – 59: women, n= 6,141; men: n= 5,772 • Response rate: 72% and 69% • On marital status, slight over-representation of married of all ages, and under-representation of single men (20s, 30s and 40s) and women (20s) • Methods: multi-way tables, log linear analysis
Marital History of Currently Cohabiting, 20 - 59 Source: GHS 2001 and 2002
Inequality of Earnings According to Marital Status Cohabiting Couples aged 20-59 Source: GHS 2001 and 2002
Earnings Inequality According to Age Group, Men and Women aged 20 to 59 Women Men 2/3 1/3 Source: GHS 2001 & 2002
Marital Status: Men and Women age 20 to 59 Source: GHS 2001 & 2002
Cohabiting women aged 20 – 59, proportions with children & mean age in each marital status Source: GHS 2001 and 2002
Cohabiting men aged 20 – 59, proportions with children & mean age in each marital status Source: GHS 2001 and 2002
Children and Earnings • 54% of mothers with a child under 5 are in employment, 66% with a child under 16; the majority part-time • 91% of fathers are in employment, almost all full time • Fathers work the longest hours of all men • The motherhood ‘pay gap’, the fatherhood ‘premium’
Loglinear Analysis • A means of analysing multi-way contingency tables – resembles a correlation analysis • Model specifies how the size of a cell count depends on the level of the categorical variable for the cell • The saturated model permits all associations and interactions and is a perfect fit to the data (in a four way table: all 2 way associations, all 3 way interactions, and the 4 way interaction) • Tests of partial association compare different loglinear models with association and interaction terms omitted; using maximum likelihood estimation the model is compared with the saturated model. • The likelihood ratio test compares models by the difference of the G2 goodness of fit statistic. A probability of more than 0.05 indicates a well fitting model at 95% confidence. • Aim: to seek the most parsimonious well-fitting model
Loglinear Model • Used here to examine, for men and women separately, the four way contingency table: • Earnings inequality in couple, grouped (I) • Marital Status (M) • Age group of youngest dependent child in the family (C) • Age group of Respondent (A)
Women • Good model fit with all 3 way interactions • Poor model fit with all 2 way associations • Important 3 way interaction for the model is A*C*M – interaction between own age, age of youngest child, and marital status • Important 2 way associations are A*I and C*I – associations between own age and inequality, and age of youngest child and inequality • Association between marital status and inequality does NOT improve the model fit
Men • Good model fit with all 3 way interactions • Each 3 way interaction can be dropped from the model leaving a good model fit • Good model fit with all 2 way associations (A*C + A*M + A*P + C*M + C*P + M*P) • No 2 way association can be dropped from the model – they are all important • Association between marital status and inequality is NEEDED for the model to fit
Conclusions: Men • In considering earnings inequality within partnerships, marital status matters for men • Never married and divorced men are more likely to be cohabiting with a partner with more equal earnings than men in either a first or second marriage
Conclusions: Women • In considering earnings inequality within partnerships, marital status is not an explanatory variable. • Variation in earnings inequality among women of different marital status is explained by their age, and their maternal history. Motherhood and how old they are is largely determinative of the degree of inequality in their partnerships, whether cohabiting, divorced or married for the first or second time. • The lack of legal remedies or social policies to compensate for earnings inequality related to motherhood for those not legally married is becoming a pressing issue as motherhood and marriage become more distinct.