Download
1 / 14
140 likes | 233 Views
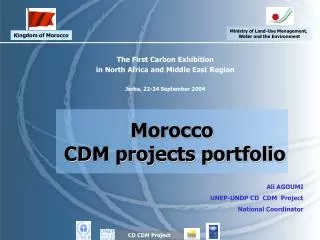
The First Carbon Exhibition in North Africa and Middle East. Djerba, 22 – 24 sept. 2004. Atténuation des émissions de GES en Tunisie. Néjib OSMAN Agence Nationale pour la Maîtrise de l’Energie. Sommaire. Travaux d’atténuation en Tunisie. Contexte énergétique. Contexte environnemental.

E N D
The First Carbon Exhibition in North Africa and Middle East Djerba, 22 – 24 sept. 2004 Atténuation des émissions de GES en Tunisie Néjib OSMAN Agence Nationale pour la Maîtrise de l’Energie
Sommaire Travaux d’atténuation en Tunisie Contexte énergétique Contexte environnemental Potentiel et Plan d’action Potentiel Plan d’action Contribution du MDP Conclusion
Projet TUN Projet RAB Atténuation 1997 - 2001 PNUD Communication Nationale Portefeuille de projets Activités CIEDE Engagement CCNUCC
ANME PNUD ACDI Projet CIEDE Atténuation 2002 - 2004 Projet SAGES INVENTAIRE ARTICLE 6 Plan d’action Portefeuille de projets PDD Opportunités PK (énergie)
- Ressources - Demande Contexte énergétique Efficacité Energétique Déficit 0.9 Mtep (MTEP) Excédent 3 Mtep Energies Renouvelables
Forêts et CAS Déchets Déchets Forêts et CAS Agriculture 3,7% 12,4% 20.9% 7.5% 11.1% Agriculture Énergie 60.5% 20,2% Procédés Industriels 10,3% 53,4% Énergie Principaux résultats de la Com. Nat. Potentiel d’atténuation 2002-2020 Inventaire des émissions de GES (1997) 240 MTE CO2 32 MTE-CO2 Par habitant: 2,7 Te-CO2 (Mond. ≈ 4) Par unité de PIB:1,9 Te-CO2 /1000 $ (Mond. ≈ 0,71) Plan d’action d’Atténuation de GES par la Maîtrise de l’Energie
21 options d’atténuation Référence Atténuation Potentiel d’atténuation ( MTE-CO2) 21 options d’atténuation 2004 – 2020 Enjeux : Economie d’Energie = 50 Mtep Emissions évitées = 143 MTE-CO2
Réglementation thermique Autres 25 % Cogénération ESCO 75 % CES Industrie Energies Renouvelables Biogaz Eolien Efficacité énergétique Potentiel d’atténuation (Principales Options) 143 MTE-CO2
Plan d’action d’atténuation ( MTE-CO2) 21 options d’atténuation Axes du plan d’action 2004-2011 Cadre Réglementaire Renforcement de capacités Mécanismes de financement Sensibilisation Développement industriel
Critères et Indicateurs de Développement Durable Objectif Évaluation des options du point de vue DD Méthodologie = Approche participative 4 Critères et 25 Indicateurs de Développement Durable Balance de paiement Critères économiques IED Emploi Critères sociaux Santé Gaz à Effet de Serre Critères environnementaux Pollution atmosphérique Indépendance énergétique Critères stratégiques Partenariat / Privé
Contribution du MDP à la mise en œuvre du plan d’action 17 % 3 % 5 % 17 % 19 % 15 % 17 % 16 % 5 % 38 % 82 989 58% Développement Durable Priorités Nationales Accès au MDP Secteur privé 12 % 3 297 380
Activités transversales (Formation / CIEDE) Activités Méthodologies Inventaire Logiciel IPCC / Indicateurs Atténuation MEDPRO-Environnement Lignes de Base Cycle de projets PDD MDP
CONCLUSION Mise à jour du Potentiel Potentiel de projets MDP Portefeuille de projets Portefeuille consistant Stratégie d’Atténuation Stratégie MDP Critères DD / ME Critères DD / MDP Plan d’action Plan d’action MDP Plusieurs PDD 2 PDD