Download
1 / 1
10 likes | 172 Views
GOES Cloud Products and Cloud Studies. Anthony J. Schreiner 1 , Timothy J. Schmit 2 , W. Paul Menzel 2 , Jun Li 1 , James A. Jung 1 , Steven A. Ackerman 1 , Wayne F. Feltz 1 , Robert M. Aune 2

E N D
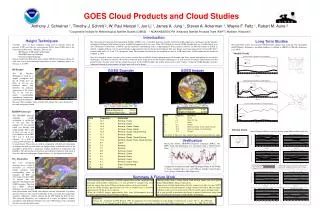
GOES Cloud Products and Cloud Studies Anthony J. Schreiner 1, Timothy J. Schmit 2, W. Paul Menzel 2, Jun Li 1, James A. Jung 1, Steven A. Ackerman 1, Wayne F. Feltz 1, Robert M. Aune 2 1 Cooperative Institute for Meteorological Satellite Studies (CIMSS) 2 NOAA/NESDIS/ORA Advanced Satellite Products Team (ASPT) Madison, Wisconsin Introduction Height Techniques Long Term Studies The Geostationary Operational Environmental Satellite (GOES) series of satellite platforms includes two Infrared (IR) radiometers, the Imager and the Sounder instruments. Radiance information has been available for approximately ten years. From 1994 through the present GOES Sounder data are available hourly over the CONtinental United States (CONUS) and the immediate surrounding waters at approximately 10 km spatial resolution. In 2001 the launch of GOES-12 offered a slightly different suite of spectral bands at approximately four km horizontal resolution. This new Imager instrument replaced the 12.0 µm IR “dirty” window band with a 13.3 µm “CO2 absorption” band. The Sounder instrument has not modified its suite of 18 IR bands and 1 Visible band since the launch of GOES-8 in 1994. Due to its length of service (ten plus years to date), routine data availability (hourly information for the Sounder and thirty minute hemispherical coverage for the Imager), and spatial resolution (10 and 4 km at the sub-point, respectively for the Sounder and Imager) it is now possible to examine cloud trends over that period of time. To some extent this has already been done for the GOES Sounder and will be shown over several “regions” within the GOES Sounder coverage. Additional diurnal of characteristics of high clouds will also be shown. • Currently there are three techniques being used to generate cloud top pressure (CTP) and effective cloud amount (ECA) from GOES data at the University of Wisconsin – Madison. They are the: • IR Window (or IR Look Up)Technique • H2O/IRW Intercept Technique • CO2 Absorption Technique. • Each is briefly described below and a sample CTP derived image is shown for each case. For a more thorough explanation of these techniques please see Nieman, et al (1993). All cloud trends results are based on GOES Sounder radiance data using the CO2 Absorption and IR Window Techniques, and High cloudiness is defined as 300 hPa to 100 hPa (Schreiner, et al. 2001). Monthly Trends • IR Window • The IR Window Technique is based on a simple assumption that the all clouds have an ECA of 1.0 (or are infinitely thick), and therefore the radiating temperature of the cloud, Tbc, in the 11.0 µm region corresponding atmospheric temperature at the top of the cloud are GOES Sounder GOES Imager • the same. This technique works well for thick clouds, but is less than perfect for semi-transparent clouds. Fig. 5. Sample GOES Sounder CTP DPI. Fig. 4. Sample GOES Imager CTP DPI. Spatial Resolution 4 km Temporal Resolution 30 min Spatial Resolution 10 km Temporal Resolution 60 min • H20/IRW Intercept • The H2O/IRW Intercept technique height assignment is predicated on the fact that the radiances for two spectral bands vary linearly with cloud amount. Thus a plot of H2O (6.5 µm or 6.7 µm) radiances versus IRW (10.7 µm or 11.0 µm) radiances in a field of varying cloud amount will Band Frequency Some Uses 1 Vis Clouds 2 3.9 Snow, fire, fog 3 6.7 Winds (3 6.5 Winds)* 4 10.7 Retrieval, Clouds, Snow, Cloud-Clearing 5 12.0 Retrieval, Clouds, Cloud-Clearing* (6 13.3 Clouds)* * For GOES-12 Band 3 has been modified, Band 5 eliminated, and Band 6 added. Band Frequency Some Uses 1 14.7 Retrieval, Ozone 2 14.4 Retrieval, Ozone 3 14.0 Retrieval, Ozone, Clouds 4 13.7 Retrieval, Ozone, Clouds 5 13.4 Retrieval, Clouds, Cloud-Clearing 6 12.7 Retrieval, Clouds 7 12.0 Retrieval, Clouds, Cloud-Clearing 8 11.0 Retrieval, Clouds, Snow, Cloud-Clearing 9 9.7 Ozone 10 7.5 Retrieval 11 7.0 Retrieval 12 6.5 Retrieval, Ozone 13 4.6 Retrieval, Ozone 14 4.5 Retrieval, Ozone 15 4.4 Retrieval, Ozone 16 4.1 Retrieval, Ozone, Snow 17 4.0 Snow, Cloud-Clearing 18 3.8 Snow Diurnal Trends Diurnal Change of Effective Cloud Amount over Central Plains for High Clouds Only Winter 1997/98 (#obs. 9,400) Spring 1998 (#obs. 9,167) Verification Frequency of Occurrence During the Atlantic THORPEX Regional Campaign (ATReC, Dec. 2003) cloud top information was measured using a Cloud Physics Lidar. • be nearly linear. These data are used in conjunction with forward calculations of radiance for both spectral bands for opaque clouds at different levels of the atmosphere specified by a numerical weather prediction of temperature and humidity. The intersection of measured and calculated radiances will occur at clear sky radiances and opaque cloud radiances (i.e. the height of the cloud). Time (LST) Time (LST) Summer 1998 (#obs. 12,267) Fall 1998 (#obs. 10,058) Frequency of Occurrence • CO2 Absorption • The CO2 Absorption technique uses a ration of deviations in observed cloudy radiances from corresponding clear air radiances for IRW and CO2 bands (for the GOES-12 Imager and two adjacent CO2 bands for the GOES Sounder). The clear and cloudy radiance differences are determined Thin (0<ECA<50) Thick (50<ECA95) Opaque (95<ECA100) • “Central Plains” includes 31N to 45N and 92W to 107W. • “High Clouds” is defined as layer from 300 to 100 hPa Comparisons of lidar measured cloud top height (black) to the GOES-12 Imager Cloud Product (red) and GOES-12 Sounder Cloud Product (blue) along a 5 December 2003 flight track. Winter 1998/99 (#obs. 7,305) Spring 1999 (#obs. 8,420) Summary & Future Work Frequency of Occurrence • Given the long-term availability of GOES radiance data and the techniques for generating cloud product information it is now possible to examine long term trends on various time scales. Differing climatic regimes can be investigated. • From the GOES Sounder approximately ten years of CONUS data is available (approximately 10 km & 1 hr resolution). • From the GOES-12 Imager approximately three years of hemispheric data is available (approximately 4 km & 30 min resolution). • Recent results show a strong annual trend of high clouds over the CONUS using GOES Sounder radiance information. • Annual max of high clouds during the late summer/early fall over the CONUS is driven by the increased frequency of high clouds in the Gulf of Mexico region. • Diurnal trends can be seen in both the effective cloud amount for high clouds. • It is now possible to determine the change in diurnal cloud trends using either the GOES Sounder or Imager or both radiance information. Time (LST) Time (LST) Summer 1999 (#obs. 18,526) Fall 1999 (#obs. 4,658) • from observations with GOES and radiative transfer calculations. It assumes the emissivities are the same for both bands so the ratio of the clear and cloudy radiances differences yields a solution for the CTP within the field of view. The observed differences are compared to a series of radiative transfer calculations with different cloud pressures; the CTP belongs to the calculation that best satisfies the observations. Frequency of Occurrence References Nieman, S.J., J. Schmetz and W.P. Menzel, 1993: A comparison of several techniques to assign heights to cloud tracers. J. Appl. Meteor.,32, 1559-1568. Schreiner, A.J., T.J. Schmit and W.P. Menzel, 2001: Observations and trends of clouds based on GOES sounder data. J. Geophys. Res.,106, 20349-20363.