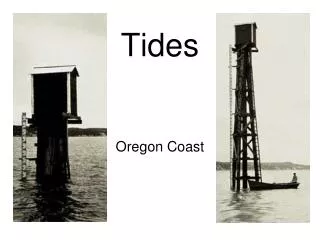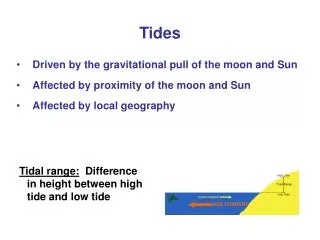
Tides
Tides. Wilmington, NC. Dauphin Island, Al. Alcatraz Island, CA . Observe your tide. Notice the tide graph is for 1 week 10/18 - 10/25 Notice that your tide graph has high points and low points Notice that the time is marked in 6 hour intervals.


Tides
E N D
Presentation Transcript
Observe your tide • Notice the tide graph is for 1 week 10/18 - 10/25 • Notice that your tide graph has high points and low points • Notice that the time is marked in 6 hour intervals
During each 24 hour period from 4/3 – 4/9: • Label your tide graph with the following terms: • High-high – highest level/24 hrs • Low-high – lower high tide/24 hrs • High-low – higher low tide/24 hrs • Low-low – lowest level /24 hrs
Types of tides • Use the following definitions to determine what type of tide yours is and label it on the top. • Diurnal Tides - A single high and low tide each lunar day • Semidiurnal Tides - Has two high tides and two low tides each lunar day. The heights of successive high tides and successive low tides are approximately the same. • Mixed Tides- Successive high tides and/or low tides will have significantly different heights
Explain your Decision • Now, take turns explaining to the other members in your group why you have defined your tide as you did. • On the front of your graph, write the definition of your tide. • On the back of your graph sketch and label the two other tides with their definitions.
Group discussion: • On each tide graph find the highest high tide. Within your group, discuss why the high tide increases or decreases throughout the week. • Now, predict where along the U.S. coastlines you would find each of the three types of tides.