ANOVA: Factorial Designs
130 likes | 491 Views
ANOVA: Factorial Designs. Experimental Design. Choosing the appropriate statistic or design involves an understanding of The number of independent variables and levels The nature of assignment of subjects to treatment levels http://psych.athabascau.ca/html/Validity/index.shtml.

ANOVA: Factorial Designs
E N D
Presentation Transcript
Experimental Design • Choosing the appropriate statistic or design involves an understanding of • The number of independent variables and levels • The nature of assignment of subjects to treatment levels • http://psych.athabascau.ca/html/Validity/index.shtml
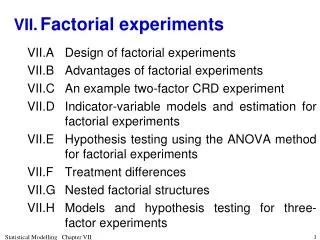
Review of a Few Designs • Subjects are completely randomly assigned to treatments • Completely Randomized ANOVA: One treatment with two or more levels • Completely Randomized Factorial ANOVA: Two or more treatments each with two or more levels • Treatments assigned to homogenous blocks of experimental units or repeated measures used to control for nuisance variation • Randomized Block ANOVA: One treatment with two or more levels
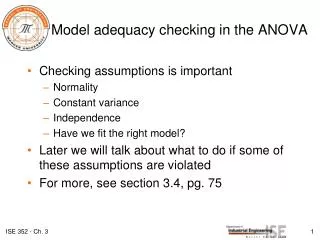
The secret to mastering two-factor analysis of variance • In a two-factor analysis of variance, we look at interactions along with main effects. • Interactions are the effect that one factor has on another factor. • The main effectof a factorlooks at the mean response obtained by averaging each factor (IV) over all levels. • A two-factor ANOVA should begin with an examination of the interactions. Interpretation of the main effects changes according to whether interactions are present.
Two-factor ANOVA • Consists of three significance tests: • Each of the main effects (A and B) • Interaction of the two factors (AB) • There is an F-test for each of the hypotheses: the mean square for each main effect and the interaction effect divided by the within-variance (MSE).
Hypothesis testing • The first hypothesis (main effect of factor A): • looks at the mean response for each level of A--that is, the mean obtained by averaging over all levels of B--and asks whether they are the same. This is the case whether or not there is an interaction in the underlying model. • The second hypothesis (main effect of factor B): • looks at the mean response for each level of B--that is, the mean obtained by averaging over all levels of A--and asks whether they are the same. This is the case whether or not there is an interaction in the underlying model. • The third hypothesis (interaction effect): • asks whether or not factor A has an effect on factor B.
A demonstration of a two-factor ANOVA • http://www.ruf.rice.edu/~lane/stat_sim/two_way/index.html
Let’s use an example we’ve seen before • In this study, interviewers telephone calls to adults in randomly selected households to ask opinions about the next election. • Treatment A: introduction • A1: Gave name • A2: Identified the university he/she was representing • A3: Gave name and identified the university. • Treatment B: copy of survey? • B1: Interviewer offered to send a copy of final results • B2: Interviewer did not offer to send a copy of the final results
For default there is an effect of B but not A. Make up data where… • …there is an effect of A but not B and no interaction. • …there is an effect of B and an interaction, but no effect of A. • …there is a cross-over interaction.
What part of the ANOVA summary table is unaffected by group size? • Is it necessary for lines to cross to have a significant interaction?
Conclusions • If there is no significant interaction, the means for the levels of factor A will behave like the expected values from any of the individual levels of B. • If there is a significant interaction, the hypotheses for the main effects are the same (we still test whether the means obtained from each level of A by averaging over all levels of B are the same.) However, if the model includes an interaction, this hypothesis might not be useful. • Look first at the interaction; never analyze or interpret main effects in the presence of an interaction.
Never interpret main effects in the presence of interactions Survey response rate based on no compensation vs. $5. Suppose B1 (circles) were males and B2 (squares) were females. • Graph 1: Since the means of the two levels of A are equal, the main effect of A is 0. Yet, it would be a huge mistake to say that A doesn't matter. Who benefits from what? • Graph 2: How do males compare to females in terms of response rate based on compensation? What would you do with this information if you were advising how to reward completed surveys? • Graph 3: How do males compare to females in terms of response rate based on compensation? What would you do with this information if you were advising how to reward for completed surveys? • Graph 4: Do males and females differ in terms of response rate? Explain.