Download
1 / 26
260 likes | 372 Views
Diploma Macro Paper 2. Monetary Macroeconomics Lecture 3 Aggregate demand: Investment and the IS-LM model Mark Hayes. Outline. Introduction Map of the AD-AS model This lecture, continue explaining the AD curve

E N D
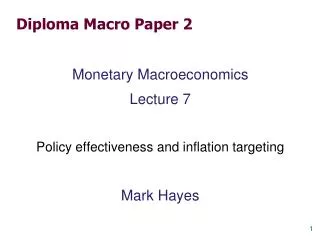
Diploma Macro Paper 2 Monetary Macroeconomics Lecture 3 Aggregate demand: Investment and the IS-LM model Mark Hayes
Outline • Introduction • Map of the AD-AS model • This lecture, continue explaining the AD curve • Last time, Step 1: Equilibrium with variable income and consumption – the Keynesian Cross • Step 2: Equilibrium with variable income, consumption and investment – the IS-LM model • This lecture highly theoretical, we look at the data with the help of the model next time
Phillips Curve (,u) Exogenous: M, G, T,i*, πe Goods market KX and IS (Y, C, I) Labour market (P, Y) AS AD-AS (P, i, Y, C, I) Money market (LM) (i, Y) IS-LM (i, Y, C, I) AD Foreign exchange market (NX, e) AD*-AS (P, e, Y, C, NX) IS*-LM* (e, Y, C, NX) AD*
Phillips Curve (,u) Exogenous: M, G, T,πe Goods market KX and IS (Y, C, I) Labour market (P, Y) AS AD-AS (P, i, Y, C, I) Money market (LM) (i, Y) IS-LM (i, Y, C, I) AD Foreign exchange market (NX, e) AD*-AS (P, e, Y, C, NX) IS*-LM* (e, Y, C, NX) AD*
The IS curve Definition: a graph of all pairs of i and Y that result in goods market equilibrium i.e. value of output Y = expected expenditure E Expected consumption C is an increasing function of income Y, as in the Keynesian Cross PLUS: Expected investment I is now a decreasing function of the money rate of interest i The equation for the IS curve is:
Money and real interest rates Mankiw uses r to mean both nominal (money) and real interest rates. This confuses the Classical and Keynesian models. In a monetary model, only the money rate (i) exists as a causal variable. The real interest rate only exists in a corn model. What does exist in a monetary model is the expected rate of inflation e. This is exogenous here. Investment depends on i- e For clarity always use iin a monetary model
A note on curve shifting A curve (or line) in a diagram is a relationship between two endogenous variables Movement along the curve shows how one variable changes if the other does We are mainly interested in comparing equilibrium positions, how the point of intersection moves A change in an exogenous variable shifts a curve, which moves the equilibrium position Movement along a curve only happens in disequilibrium and may not be realistic
i Spending on investment goods is a downward-sloping function of the interest rate I(i) I The investment demand curve
i I(i, e2) I The investment demand curve e2>e1 I(i, e1)
E I Y i Y Deriving the IS curve i I E =Y E =C +I(i2)+G E =C +I(i1)+G E Y Y1 Y2 i1 i2 IS Y1 Y2
E Y i Y Y Shifting the IScurve: G At any value of i, G E Y E =Y E =C +I(i1)+G2 E =C +I(i1)+G1 …so the IS curve shifts to the right. Y1 Y2 The horizontal distance of the IS shift equals i1 IS2 IS1 Y1 Y2
Y Shifting the IS curve: T E =Y E E =C1+I(i1)+G At any value of i, T C E E =C2+I(i1)+G …so the IS curve shifts to the left. Y Y1 i Y2 The horizontal distance of the IS shift equals i1 IS1 IS2 Y Y1 Y2
LM i IS Y The short-run equilibrium: IS-LM Equilibrium interest rate Equilibrium level of income
The money market What determines the money interest rate? NOT the supply and demand for loanable funds! In the monetary model, the interest rate clears the money market, matching the supply and demand for a stock of money In the Classical model, the interest rate clears the loanable funds market, matching the supply and demand for flows of saving for investment Oil and water!
Money supply The supply of real money balances is fixed: M/P real money balances
Money demand (holding Y constant) Demand forreal money balances: M/P real money balances
Equilibrium (holding Y constant) The interest rate adjusts to equate the supply and demand for money: M/P real money balances
Central Bank can raise the interest rate To increase , CB reduces M interest rate 2 1 M/P real money balances
The LM curve The LMcurve is a graph of all combinations of iand Y that equate the supply and demand for real money balances. The equation for the LMcurve is:
i i LM L(i,Y2) L(i,Y1) Y M/P Y1 Y2 Deriving the LM curve (a) The market for real money balances (b) The LM curve i2 i2 i1 i1
i i LM2 LM1 L(i,Y1) Y M/P Y1 How M <0 shifts the LM curve (a) The market for real money balances (b) The LM curve i2 i2 i1 i1
LM i IS Y The short-run equilibrium: IS-LM The short-run equilibrium is the combination of i and Y that simultaneously satisfies the equilibrium conditions in the goods & money markets: (IS) (LM) Equilibrium interest rate Equilibrium level of income
i P LM(P2) LM(P1) i2 i1 IS Y Y P2 P1 Deriving the AD curve Intuition for slope of AD curve: P (M/P) LM shifts left i I Y Y1 Y2 AD Y2 Y1
Summary We have derived the AD curve as a set of pairs of P and Y consistent with simultaneous equilibrium in the goods and money markets The building blocks of the AD curve are the Keynesian Cross and the IS-LM model We now have four endogenous variables: Y, C, I and i Exogenous variables include P, M, G and T
Next time • Applying the IS-LM model: • Fiscal policy • Monetary policy • Revise this lecture and make sure you understand how the model works before the next lecture! • Especially: consider the meaning of different slopes of the IS and LM curves