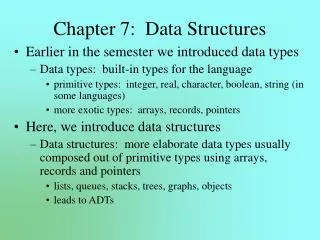
Data for Decisions Chapter 7
This chapter from "Data for Decisions" explores various sampling methods, emphasizing the importance of random sampling, experimental design, and confidence intervals. It distinguishes between populations and samples while discussing biases and the significance of using proper sampling techniques to derive accurate insights. Through examples like the monthly unemployment rate survey and Gallup polling, the text provides practical applications of statistical inference. Key concepts such as observational studies, confounding variables, and the margin of error in confidence intervals are also examined.


Data for Decisions Chapter 7
E N D
Presentation Transcript
Data for DecisionsChapter 7 Austin Cole February 16, 2010
Outline I. Sampling a. Bad Sampling Methods b. Random Sampling II. Experiments III. Applying Sample to a Population IV. Simulations V. Confidence Intervals VI. Discussion
Population- entire group of individuals about which we want information Sample- part of population from which information is collected Sampling
Monthly unemployment rate based on survey of 60,000 households Define population Define unemployed Final percentage Unemployment
Convenience sample-sample of easiest to reach members of population Bias-systematically favoring a certain outcome Voluntary Response Sample-people choose to respond to a general appeal Bad Sampling Methods
Every individual in population has equal chance to be sampled Table of random digits Simple Random Sampling
Undercoverage-group of the population is left out when choosing sample Nonresponse-individual chosen doesn’t participate Wording of questions Cautions about Sample Surveys
Observational Study Experiment-imposes some treatment on individuals to observe their responses Confounding variables-variable whose effects cannot be distinguished Control group Experiments
Online vs. classroom courses Randomized Comparative Experiment
1.Starting on line x, read 2-digit groups until you have chosen 6 restaurants. 2.Ignore groups not in the range and ignore any repeated labels. Random Sampling Exercise • Starting at line 105: 07, 19, 14, 17, 13, 15
Placebo effect Double-blind experiment Prospective studies Thinking about Experiments
Statistical inference-using fact of a sample to estimate about whole population Parameter-fixed number that describes population Statistic-number that describes a sample Sampling Distribution-distribution of values taken by the statistic in all possible samples of the same size from the same population From Sample to Population
Shape Center-mean of sampling distribution (g) Spread-standard deviation of sampling distribution Assessing simulations g(1- g) n
Percent of all samples will produce an interval containing the true population parameter 68-95-99.7 Rule Margin of error for 95% confidence interval: Confidence Intervals ĝ(1- ĝ) 2 n
A Gallup poll asked a random sample of 1785 adults if they attended church or synagogue in the last 7 days. Of the respondents, 750 said yes. Find the 95% confidence interval. Exercise ĝ(1- ĝ) ĝ=.42 =.023 n 95% Confidence Interval: .376 to .466
Discussion • In real world examples, what are some uses of knowing the spread/standard deviation? • Other uses/applications for this information? 9,38,44a (7th edition) Homework Problems: