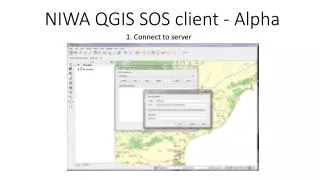
Download
1 / 31
370 likes | 470 Views
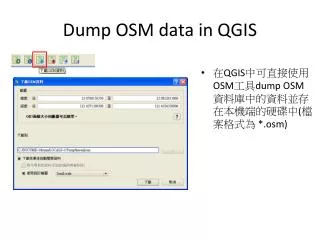
Discover essential skills to navigate through QGIS smoothly for effective mapping and analysis. Explore topics like managing layers, grouping layers, fixing broken links, symbology, classification methods, and more.

E N D
Navigating with QGIS Navigating with QGIS 1
The QGIS Desktop interface Title bar Menu bar Map View Layer List (Table of Contents)Dockable Tools toolbar Tear-off and dockable Toolbar Status bar Navigating with QGIS 2
Map and Print Composer Views - Map View (data view) -For display, queries, editing, and analysis - Print Composer -For creating map layouts for output Print Composer View Map View (data view) Navigating with QGIS 3
Layers, data frames, and maps • Map contains: • Data frames • Layers • Map elements • - Data frame • Organizes layers • Layers • Represent symbolized spatial data Data frame Layers Navigating with QGIS 4
Managing the Table of Contents (TOC) • Drag layers up or down to change display order • Smart defaults for layer draw order: point, lines, or polygons • Layers draw in the TOC in order, from the bottom up • Remove layers Navigating with QGIS 5
Layers - Reference spatial data sources - Set symbols, labels and other properties - Manipulate through context menu - Layer properties can be saved and shared as a style layer file (.sld) Navigating with QGIS 6
Group Layers • Group Layers: • Allow layers with similar thematic content to be grouped as one collection • Control when collection layers are drawn (visible) on map • Useful for managing a collection of layers Create New Group Layer Right-click on Data frame > New Group Layer Navigating with QGIS 7
QGIS Project (.qgs) - Hold layers, data frame, graphics, map elements - Store information in a map document (.qgs) file - No spatial data is stored in the .qgs file. Navigating with QGIS 8
CENSUS Group Layer EMS Group Layer Adding Layers to Group Layers • To add a layer to a group layer: • Add New Group • Drag and drop layers under new group layer Navigating with QGIS 9
Broken link to datasource • A layer keeps track of the location of the data source • A broken link to a data source may happen for several reasons: • Deleted data source • Change folder or data source name • Corrupted data source • Layer with broken link to data source • Red typing appears Navigating with QGIS 10
Fix Broken link to datasource • Right-click on Layer • Navigate to data directory • Select Data Source • Repeat until no more broken links (red) are fixed Navigating with QGIS 11
Fix Broken link to datasource All layers showing OK Ready to work! Navigating with QGIS 12
Query Identifying specific features Identifying features based on conditions Parish with a population greater than 2,000 and less than 6,000 (6,000 > x > 2,000) Navigating with QGIS 13
Join Tabular Data • One-to-one or many-to-one relationships Must be based on a common field. • The names of the common fields need not be identical but the fields must be the same type and content (e.g., text, date, float, etc.) • The fields from Source table are appended to the Target layer • Joined tables are not permanently connected Navigating with QGIS 14
Labeling - Label features based on attribute values - Control labeling from Layer properties Navigating with QGIS 15
Maptips Dynamic label Navigating with QGIS 16
Scale-Dependent Display - Layers can be displayed at scale range - Reduces map clutter - Improves drawing speed Navigating with QGIS 17
Symbology Navigating with QGIS 18
Changing Symbol properties Navigating with QGIS 19
Changing Symbol properties Navigating with QGIS 20
Symbolizing using qualitative values - Features - Categories Navigating with QGIS 21
Layer Symbology in QGIS • Graduated Colors • represent quantities on a map by varying colors, as a choropleth map • values are grouped into classes • each class is identified by a particular color • QGIS provide different color ramps to symbolize data Ideal use: features with changing numerical values Navigating with QGIS 22
Layer symbology in QGIS (cont.) Ideal use: features with changing string / alphanumeric values • Unique Value • represent “Strings” on a map by varying colors • values are grouped into classes • each class is identified by a particular color Navigating with QGIS 23
Classification Methods • Equal Interval • divides the range of attribute values into equal-sized sub-ranges • specify the number of intervals • QGIS determines where the breaks should be Navigating with QGIS 24
Classification Methods (cont.) • Natural Break (Jenks) • Classes are based on natural groupings inherent in the data • QGIS identifies break points by picking the class breaks that best group similar values • features are divided into classes whose boundaries are set where relatively big changes in values exist Navigating with QGIS 25
Classification Methods (cont.) • Quantile • Uses an equation to divide values into equal-sized subsets • For example, if you have 15 records and five classes, each class will have 3 records • Each class contains an equal number of feature Navigating with QGIS 26
Classification Methods (cont.) • Standard Deviation • show how much a feature's attribute value varies from the mean • QGIS calculates the mean values and the standard deviations from the mean • class breaks are then created using these values Navigating with QGIS 27
Symbolizing using quantitative values • Charts • symbolize multiple attributes on one map • communicate the relationship among different attributes. • Can bar and pie charts-over features. Navigating with QGIS 28
Things to be aware of Deciding which attributes and symbology to use requires some planning. Before you start collecting any GeoSpatial data, you should ensure you know what attributes are needed and how it will be symbolised. It is very difficult to go back and re-collect data if you plan poorly the first time around. Remember also that the goal of collecting attribute data is to allow you to analyse and interpret spatial information. How you do this depends on the questions you are trying to answer. Symbology is a visual language that allows people to see and understand your attribute data based on the colours and symbols you use. Because of this you should put a lot of thought into how you symbolise your maps in order to make them easy to understand. Navigating with QGIS 29
What have we learned? • Fields can contain numerical, string (any text) and date information • The attribute data for a feature can be used to determine how it is symbolised • Graduated colour symbology groups the data into discrete classes • Continuous colour symbology assigns colours from a colour range to the features based on their attributes • Unique value symbology associates each different value in the chosen attribute column with a different symbol (colour and style) • If the attribute of a vector layer is not used to determine its symbology, it is drawn using a single symbol only • Different classification methods, Equal Interval, Natural Break (Jenks), Quantile, STD • Symbolizing using quantitative values. pie chart and text diagrams Navigating with QGIS 30
Question? Navigating with QGIS 31