Download
1 / 18
190 likes | 213 Views
Discover the groundbreaking research and technology innovations in geospatial computing at ORNL, spanning 30 years of rich history. Explore ongoing research highlights in surface water analysis, image archives, and transportation routing. Learn about tools for data visualization and watershed characterization.

E N D
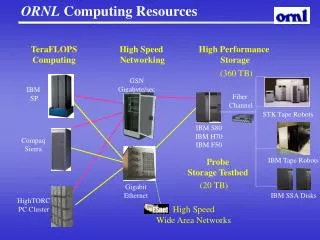
Overview of Geospatial Computing at ORNL Budhendra Bhaduri Geographic Information Science & Technology Computational Sciences and Engineering Division
ORNL: A pioneer in Geospatial Science and Technology Rich History Spanning 30 years Defining Geospatial Research Agendas Developing New Algorithms, Software, and Data Conducting Verification & Validation Studies
Technology Highlights • Geospatial Science • Multi-resolution data analysis • Advanced spatial modeling • Data integration and visualization • Geographic Information Systems (GIS) • Decision Support Systems (DSS) • Scientific Data Access • Collection, Distribution, and Management • Large scale data manipulation
Ongoing Research Highlights • Analysis of surface drinking water systems and source water characterization • I2IA: Feature-based characterization of large image archives • Transportation Routing Analysis GIS (TRAGIS) • LandScan: High resolution population distribution model
Source Water Characterization • Georeferencing Community Water System (CWS) intakes to the National Hydrography Data (NHD) • Delineating upstream contributory watersheds from the intake locations • Characterizing upstream contributory watersheds with pesticide usage data
CWS intakes CWS Intakes • 6945 intake location • 6361 indexed to NHD • 30% validated so far • Characterization and visualization tools developed
Watershed Characterization • Land cover/Land use • Pesticide application • 1992 • 1997 • Total by compound • Total by crop type • By crop-compound combinations • 32,000 data files as initial output
The amount of data available to an image analysts today is enormous We are developing an agent-based system architecture that autonomously manages a massive but dynamic image data archive transforms that to an intelligence or information archive to aid national security needs Data Search & Retrieval Geoconformance Agents Agents Segmentation Feature Mapping Image-to-Intelligence Archive (I2IA)Assisting Image Analysts in Building and Using Archives
Geoconform Images to Create Dynamic Data Archive Monitor Distributed Data Sources Create Intelligence or Information Archive USGS Feature Search, Filtering, & Retrieval Where are the power plants? Features NIMA Data Search & Retrieval Agents Modeling and Analytical Applications & Visualization for Decision Support Systems Intelligence Archive Image Analysis, Indexing, and Characterization Geospatial Data NASA Image Data Archive Data Processing & Integration Agents NOAA Index Power plants Airports Hospitals Spatial Search & Filtering of Image Data EPA Intelligent Agents Geospatial Analysis Image Analysis
Transportation Routing Analysis GISWeb-TRAGIS • Transportation Routing Analysis GIS (TRAGIS) model is used to examine highway, rail, and waterway routes for route campaigns or future shipments • Transportation routing model used by DOE community for routing and risk assessment studies
TRAGIS Rail Network • 1:100K rail network development sponsored by Dahlgren NSWC Joint Program Office • Uniquely value added and topologically refined • Used for infrastructure assurance analysis • Also incorporated into Transportation Routing Analysis GIS model, funded by DOE/NTP
TRAGIS Routing Model • Transportation Routing Analysis GIS (TRAGIS) model is used to examine highway, rail, and waterway routes for route campaigns or future shipments • Output includes population data along routes for risk assessment models
Accepted standard for estimating population at risk by the DoD and DOS Federal agencies including DoD (DTRA, NGA), DHS (FEMA, TSA), DOE, USGS, NASA, EPA, and HHS (CDC, NIH) are current users of the data for research and development and routine exercises Over 1200 non-defense registered users worldwide including WHO and the UN agencies Used in Rand McNally’s World Goode’s Atlas and National Geographic Maps Finest spatial resolution (<1km) global population distribution ever produced Global coverage in consistent raster (GIS) format Regular (yearly) updates First to employ satellite imagery worldwide Allows quick and easy assessment, estimation, and visualization of population at risk Integrated with transportation, socioeconomic, and consequence assessment models (HPAC) LandScan Global Population Innovative approach using GIS and RS techniques to produce world’s finest population distribution model, database, and tool
LandScan USA • Very High Spatial Resolution • 3 arc second resolution (about 90 m. or 300 ft.) or finer • Finer Temporal Resolution • Nighttime (residential) and daytime population distributions • High Currency • Modeled from best available Census 2000 block data • Value Added • Demographic and socio economic characteristics for easy integration with risk and impact assessment models • Compared to Census Data • Better than census resolution for most city blocks
Intelligent Consequence Management • Real time consequence analysis • Compounding effects from disasters • Dynamic traffic assignment • GIS-data integration • Sensitivity of lead time
Near-Real Time Population Model Combining • Image processing • GIS modeling • High-performance computing