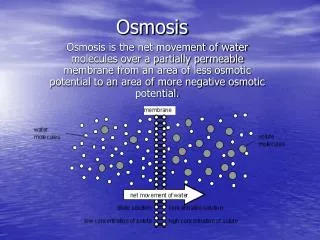
Osmosis
Osmosis. To investigate the osmotic effects of different concentrations of sugar and salt solution To use all the practical skills we have developed: data recording, presenting and analysing and evaluation of results To use data to deduce the osmotic content of the cell. Practical.

Osmosis
E N D
Presentation Transcript
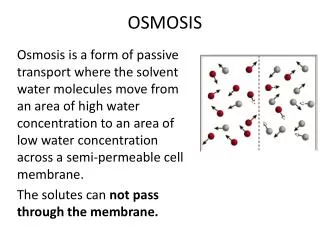
Osmosis To investigate the osmotic effects of different concentrations of sugar and salt solution To use all the practical skills we have developed: data recording, presenting and analysingand evaluation of results To use data to deduce the osmotic content of the cell.
Practical You will add chips (roditas) of potato to salt and sugar solutions of different concentrations to attempt to work out the internal concentration of the potato cells. You will work in five groups Each group will do one concentration of salt and one of sugar: 0M, 0.1M,0.3M,0.5M,0.7M You will collect, analyse and present class results then from these draw a conclusion.
Method • Weigh chips in groups of 4 and enter weight into results Table 1 • Replicate x 3 • Place chips in solutions (make sure you’ve recorded which solution you are using) • Leave for 2 days • Remove chips from solutions (do not mix them up!) • Dab dry with paper and re-weigh them • Record results in table • Calculate change in weight and enter results in Table 1 • Work out average • Find out class results and complete Table 2 • Note you can use the distilled water for 0M concentrations of both sugar and salt.
Analysis • Using table 2, draw graph of change in weight vs solution concentration for salt and sugar. • Identify the concentration on both nearest to that of the potato cells • Explain how you came to this conclusion • Criticise your results using flaws in method, and reliability to evaluate how well the investigation worked.
Further evaluation Did you recognise any differences between salt and sugar solutions? Can you explain these? How will you develop this investigation further? How could you improve the data? What other variables could you investigate? Why may these be of interest?