Osmosis
Osmosis. Today’s Lab:. Two experiments: 1. Sucrose Osmosis 2. Osmosis in green algae Based on these experiments, write a complete lab report. Include all sections of a scientific paper (i.e. title, introduction, methods, results, discussion, and conclusion). It will be 4-5 pgs.

Osmosis
E N D
Presentation Transcript
Today’s Lab: • Two experiments: • 1. Sucrose Osmosis • 2. Osmosis in green algae • Based on these experiments, write a complete lab report. Include all sections of a scientific paper (i.e. title, introduction, methods, results, discussion, and conclusion). It will be 4-5 pgs. • Due at 11:59 pm, September 25 for Monda’s lab, 26th for Tuesday, 2006 (rough drafts due September 22nd if you want comments before next lab class)
Sucrose Osmosis – Osmosis in a non-biological membrane • Purpose: • To determine an unknown concentration of sucrose • Hypothesis (two choices): • The unknown has less sucrose than most, thus the model cell will shrink (lose weight) • The unknown has more sucrose than most, thus the model cell will swell (gain weight)
Sucrose Osmosis: Getting Started • Form 4 groups with 4 people in each (I will be group 5): • Group 1 – 0.2M sucrose Group 3 – 0.6M sucrose • Group 2 – 0.4M sucrose Group 4 – 0.8M sucrose • Group 5 – 1 M sucrose • Each group will prepare 2 bags using: 2 - 6” pieces of dialysis tubing. • Soak each piece of tubing in DI water to soften it. Tie knot at one end of tube with string. Fill tubing with ~ 30ml of UNKNOWN Sucrose solution. Tie other end of each bag with a string. Attach a paperclip to end of one bag. This is Bag 1. The other is Bag 2.
Sucrose Osmosis: Continued • d. Pat dry each bag with paper towels. Weigh each bag separately. Turn on balance. Place a weighboat on the balance. Press the ‘zero’ button (indicated by a “T”). Once zero is displayed, open door and place Bag 1 on the weighboat. Close side door. Record starting mass (in grams), in your notebook for Bag 1, to two decimal places (ex. 23.36 g). Repeat for Bag 2. • Place both bags into your group’s assigned sucrose solution. Record the start time. Let stand for 1 hour. • After 1 hour, remove both bags from the beaker. Pat dry with paper towels. Re-weigh each bag, remembering to tare the balance with the weighboat on it. Record the ending mass (in grams) in your notebook for each bag, to two decimal places. • Enter all values for both bags on the Excel spreadsheet as indicated.
Osmosis in Green Algae –Osmosis in a biological membrane Purpose: To determine if two intertidal algae are euryhaline for a large salinity gradient Hypothesis: Cladophora sp. and unknown algae are euryhaline at most salinities (i.e. no changes in cell morphology)
Osmosis in Green Algae • In same groups: • Group 1 – 0 ppt Group 2 – 15 ppt Group 3 – 35 ppt • Group 4 – 44 ppt Group 5 – 65 ppt • Each group places 1 ball of Valonia sp. (bubble-shaped alga) and 2-3 strands of Cladophora sp. (hair-like alga), in individual petri- dishes. Fill petri-dish with saltwater from the 34 ppt beaker to cover algae. • Using a dissecting microscope, make careful, initial observations of each algae under the average ocean salinity (i.e. 34 ppt). Describe characteristics, including color, shape, and size. Draw an illustration in your notebook of each sample. Do not leave algae samples under the microscope lights for more than 10 minutes at a time.
Osmosis in Green Algae • Pour off the water in your sample dishes. Replace with your group’s assigned salinity. Record start time. Let stand for 10 minutes. • After 10 minutes, using a dissecting microscope, make careful, final observations of each algae. Again describe characteristics, such as color, shape, and size. Draw an illustration in your notebook of each sample e. After 1 hour, using a dissecting microscope, make careful, final observations of each algae. Again describe characteristics, such as color, shape, and size. Draw an illustration in your notebook of each sample. f. Record your qualitative observations for your samples on the table on the board at the front of the room. Copy this table with all initial and final observations into your notebook.
Salinity - Water is a universal solvent. (i.e. dissolves substances) Salinity: - Total amount of salt dissolved in seawater. Salinity refers to the number of grams of inorganic salts (i.e. NaCl) dissolved in one kilogram (1000 g) of water. Unit: g/kg = parts per thousand (ppt) What is the average salinity of the oceans?
Transport water + molecules: 3 ways • Diffusion • Osmosis • Active transport
Diffusion e.g. an open bottle of perfume in a room. (Diffusion will cause molecules to be distributed throughout the room) • Movement of molecules or ions from a region of high concentration to one of low concentration, until they are evenly distributed. (2nd law of thermodynamics, all systems tend toward disorganization, randomness)
Diffusion Figure 4.12
Diffusion Diffusion across a biological membrane: - Passive transport Diffusion against a concentration gradient; from low concentration to high concentration: - Active transport (requires an energy source, won’t discuss further for this lab)
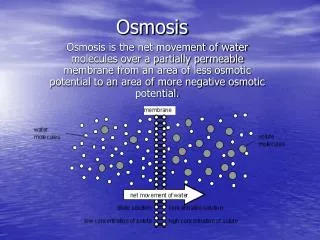
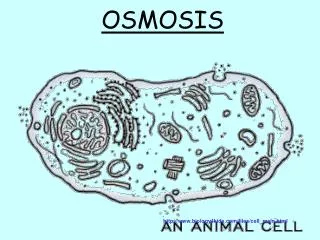
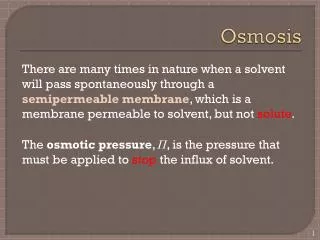
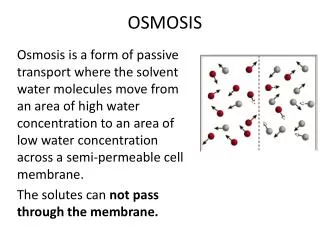
Osmosis-subset of diffusion Definition: Diffusion of WATERmolecules across semi-permeable membranes (e.g. cell membranes) until water concentrations are equal on both sides of the membrane. (Happens in cells all the time, how water gets into your body) Movement is from a higher [H2O] to lower [H2O]
Osmosis Why is osmosis important for life in the ocean?-regulate salt concentrations in tissues Osmosisis the physical process where WATERpasses through a semi-permeable membrane that separates 2 fluids with different SALT concentrations. WATER is moving from an area of: Higher [water] and lower [salt] lower [water] and higher [salt]
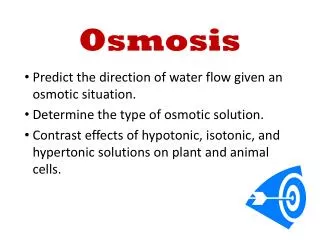
Osmosis Terms: Hyperosmotic solution (hypertonic) a solution with a greater solute concentration (i.e. more salt ions) than another Hypoosmotic solution (hypotonic) a solution with a lesser solute concentration (i.e. fewer salt ions) than another Isoosmotic solutions (isotonic): solutions of equal solute concentrations (i.e. same number of salt ions)
Osmosis Hyperosmotic Isoosmotic Hyperosmotic Hypoosmotic Hypoosmotic Figure 4.13
Related Terms Euryhaline: Organism that is able to withstand large changes in salinity - no change in cell morphology (e.g. color, shape, or size) Stenohaline: Organism that is not able to withstand changes in salinity - changes in cell morphology (e.g. color, shape, or size)
Related Terms • Osmoregulators: Organisms that can maintain a constant internal salinity despite external changes in salinity. e.g. fish, humans, too (using kidneys) • Osmoconformers: Organisms that change their internal salinity along with the external environment. e.g. various invertebrates
Osmoregulators Lower [H20] Higher [H20] Higher [H20] Lower [H20] Figure 4.14
Writing A Scientific Paper • Title: Purpose: get readers attention – concise and focused • Introduction: Sets the stage for the study and hooks reader Orients the reader – go from general to specific Explains the importance of the study – purpose and hypotheses • Methods: Includes info so that study can be repeated What measurements were made and why
Writing A Scientific Paper • Results: Summarize and illustrate your findings Do not interpret data, just report Number Figures and Legends • Discussion: Interpret your results Don’t over explain Convey confidence and authority • Conclusion: What would you differently and why?
Sucrose Osmosis: Data presentation a. You will record the data in a table in Excel. b. To calculate Absolute Weight change (g): Final Weight (t=1hr) – Initial Weight (t=0) c. To calculate % Weight Change: Absolute Weight Change x 100 Initial Weight
Sucrose Osmosis: Data presentation d.Follow the instructions on the handout to construct a graph. You will use this graph to determine the concentration of the Unknown Solution. Include the graph in your report.
Sucrose Osmosis: Unknown Solution concentration • To calculate the concentration of the Unknown Solution, use the equation generated from the trendline on the graph, in the example, y = -22.755x + 16.655. • Set y=0 and solve the equation for x. The result will be the concentration of the Unknown Solution. It will be a positive number between 0 M and 1.0M.
Osmosis in Green Algae • Observations