Download

1 / 19
200 likes | 378 Views
Nonlinear Site Effects: laboratory and field data observations and numerical modeling. Luis Fabi á n Bonilla. Institut de Radioprotection et de S û ret é Nucl é aire, France. Empirical evidence of nonlinear site effects Some models of nonlinear site response Examples. Presentation Outline.

E N D
Nonlinear Site Effects: laboratory and field data observations and numerical modeling Luis Fabián Bonilla Institut de Radioprotection et de Sûreté Nucléaire, France
Empirical evidence of nonlinear site effects Some models of nonlinear site response Examples Presentation Outline
Port Island, Kobe / Kushiro Port • Dense sand => cyclic mobility • High frequency peaks • Amplification • Loose sand => licuefaction • Lowpass filtering • Deamplification
Nonlinear Effects: TTRH02 Station (Japan) Site amplification is different for strong ground motion
PGA distribution (Kik-net) (M7, 26 Mai 2003)
How is the transfer function affected? • The shear modulus is computed as G=rb2 • The fundamental frequency of the soil is f0=b/(4H) • If G changes, so does b : • if G(-) ---> b(-) ---> f0(-) • Deamplification: the damping increases (pay attention) • Increase of the signal duration (long period waves arrive later)
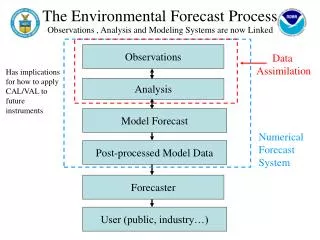
Why? There is no analytical solution Finite differences, spectral elements, finite elements methods, etc. Boundary conditions: Surface: free surface effect Bedrock: elastic boundary conditions (transmitted waves) or rigid boundary conditions (complete reflection) Numerical solutions
The equivalent linear model (1972) G-g frequency dependent (Assimaki and Kausel, 2002)
Gmax Gn G1 Shear Stress G2 G2 Shear Modulus (G) G1 Gn Gmax Shear Strain Shear Strain Iwan-Mroz Model (1967) – Plasticity Theory Backbone Reconstruction of backbone from the modulus reduction curve
Multi-spring Model (1) • 2D plane strain model • Each spring obeys the hyperbolic model • Hysteresis follows the generalized Masing rules • Capability to model anisotropic consolidation conditions Plasticity theory and phenomenological description of hysteresis
Multi-spring Model (2) • Pore pressure excess is correlated to shear work • Model space has five parameters to take into account dilatancy • Plastic parameters are angle of internal friction, and angle of phase transition • Elastic parameters are thickness, Q, density, P and S wave speeds
The M7.8 Kushiro-Oki 1993 event Vs30 = 284 m/s Dense sand deposit, first studied by Iai et al (1995)
Results Multispring Iwan-Mroz Pore pressure analysis may be needed if soil is saturated Improved EqL Trad. EqL Input
Linear 2D linear and nonlinear response of the Grenoble basin Nonlinear
The choice of rheology is important in the modeling of nonlinear site response. A desirable rheology should have the lower number of parameters that realistically model observed data. The Iwan-Mroz represents better the nonlinear soil behavior with the same data as the Eq. Linear method. However, better soil characterization is needed when having saturated medium (triaxial and centrifuge modeling). Luca Lenti, LPCP-IRSN postdoc, has developed a 3D elasto-plastic model following Iwan (1967). Only G/Gmax data are needed. We need to study which numerical integration scheme (FDM, FEM, SEM, etc.) is suitable to handle material nonlinearity. How are we going to combine all these numerical efforts? SUGGESTIONS? Perspectives