Understanding Mean, Median, Mode, and Range in Data Analysis
This guide explains the concepts of mean, median, mode, and range in data analysis. The mean is calculated by adding all numbers and dividing by the total count. The median represents the middle value when numbers are ordered; if there's no distinct middle, the average of the two middle numbers is taken. The mode is the most frequently occurring number. Lastly, the range measures the difference between the highest and lowest values in the dataset. Examples are provided for clarity.

Understanding Mean, Median, Mode, and Range in Data Analysis
E N D
Presentation Transcript
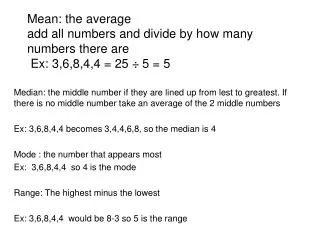
Mean: the averageadd all numbers and divide by how many numbers there are Ex: 3,6,8,4,4 = 25 ÷ 5 = 5 Median: the middle number if they are lined up from lest to greatest. If there is no middle number take an average of the 2 middle numbers Ex: 3,6,8,4,4 becomes 3,4,4,6,8, so the median is 4 Mode : the number that appears most Ex: 3,6,8,4,4 so 4 is the mode Range: The highest minus the lowest Ex: 3,6,8,4,4 would be 8-3 so 5 is the range