Download
1 / 30
300 likes | 433 Views
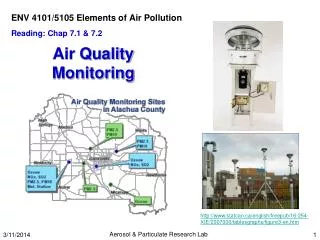
. Overview of Air Quality: Monitoring + Some Results. Ben Weinstein, BSc . Air Quality Meteorologist Ministry of Environment March 2012. Why are we here?. In BVLD Airshed people are affected by emissions of particulate matter, PM This occurs mostly in the form of wood combustion / drying

E N D
.Overview of Air Quality: Monitoring + Some Results Ben Weinstein, BSc. Air Quality Meteorologist Ministry of Environment March 2012
Why are we here? • In BVLD Airshed people are affected by emissions of particulate matter, PM • This occurs mostly in the form of wood combustion / drying • General consensus among the health community that there is no threshold at which there are no impacts. (e.g. there are no safe levels of particulate matter)
Acute and Chronic Effects • Impacts from short-term exposure: • mostly in people with pre-existing health conditions • acute health effects: • breathing problems, increase the severity and occurrences of asthma attacks, heart attacks and eye, nose and throat irritation. • Impacts from long-term exposure: • puts the entire population at greater risk of developing chronic health conditions • Bronchitis, emphysema, pneumonia, cancer, death • Also linked to pre-term births, low birth weight • More burden is attributed to long-term exposures (as much as 85% of mortalities)
Burden • Not as important as factors such as smoking or diabetes but still significant. Mortality burden of PM2.5 for Northern and Interior BC has been estimated to be between 0.2% and 0.93% (16 – 74 deaths/year)*.
Exposure Pathways Dispersion, Transport and Distance • Wind • Turbulence Receptors Emissions • Asthmatic, cardiac or respiratory patient • Children or elderly • Community • Woodstoves • Open Burning • Open Burning • Industry • Transportation Environment Canada – Clean Air Online
Woodstoves • Woodstoves operate up to 6 months of the year • Emissions exit the stack at low height and with low velocity
The Woodstove Across the Yard March 18 2010
Smithers Hotspots: • Found in older residential areas and trailer parks but also downwind of industrial point sources Estimated PM2.5 Concentrations
Open Burning (+ Backyard) • Local governments have bylaws to regulate
How Are We Doing? • Have chosen some selected indicators and some from this specific source • Overall annual averages (min 7 years for trend analysis) • Spatial mapping of PM in various communities
Houston Smithers Telkwa Burns Lake Terrace
Smithers Houston Smithers Houston Telkwa Telkwa Burns Lake Burns Lake Terrace Terrace
Looking Ahead Monitoring technology is changing in B.C. from existing instruments to more complete measurements of PM2.5 Current instruments are known to undermeasure PM2.5, especially in the cold winter months. At times, actual concentration may be 100% higher than measured
Summary • No safe threshold for effects of PM • Community sources are important due to their proximity to people • When new PM instruments come online higher concentrations expected. This will lead to more frequent AQ management