Download
1 / 33
330 likes | 552 Views
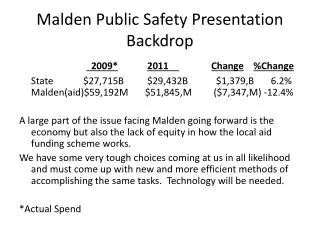
MCAS 2012 Malden Public Schools. WORKING TOGETHER TO MAKE A DIFFERENCE. Purpose of Presentation. Provide a broad overview of MCAS performance Provide a context for MCAS results by examining similar districts’ performance Highlight strengths of performance

E N D
MCAS 2012 Malden Public Schools WORKING TOGETHER TO MAKE A DIFFERENCE
Purpose of Presentation Provide a broad overview of MCAS performance Provide a context for MCAS results by examining similar districts’ performance Highlight strengths of performance Identify areas that pose a challenge and plans to address those challenges Look ahead to changes coming our way
District Overview Accountability and Assistance Levels: All Massachusetts schools and districts with sufficient data are classified into one of five accountability and assistance levels (1-5), with the highest performing in Level 1 and lowest performing in Level 5. Three schools - Ferryway, Linden, and Salemwood - earned a “Level 1” rating.
Benchmarking Results - Percentage of Students Earning “Proficient” and Above
Benchmarking Results - Percentage of Students Earning “Proficient” and Above
Benchmarking Results - Percentage of Students Earning “Proficient” and Above
2012 MCAS Results English Language Arts, Grades 3-5
Strengths of Grade 3 & 4 MCAS Results Grade 3 Advanced scores have increased from 2011 MCAS Proficient scores have increased from 2011 MCAS Failure scores have decreased from 2011 MCAS Grade 4 Advanced scores have increased from 2011 MCAS Proficiency scores have increased from 2011 MCAS
Challenges Reaching all families, accessing so many different languages Helping students simultaneously learn a language as they also have academic expectations. New ESL assessments Fifth grade MCAS scores This year the 4th and 7th grade writing assessment will be one of the following: personal narrative, expository or persuasive.
Next Steps 90-120 minute literacy block that is uninterrupted Interventions take place in the classroom, whenever possible Using data to drive instruction: DIBELS, GRADE, progress monitoring, unit benchmark tests Looking at student work and giving teachers and students feedback Schools have grade level meetings Parent Teacher meetings to keep parents informed
Next Steps con’t Embedded Response To Intervention (RTI) model Twice a year, create Instructional Plans for each classroom based on Benchmark Assessments and student work Looking at each child individually in the hopes that every child’s academic needs are being met
Title 1 and Parent Involvement • Monthly Title 1 Parent Workshops • How to help students at home with Reading and Math • Homework stresses • Understanding assessments given • Math • Technology • Writer’s Workshop
Title 1 and Parent Involvement cont’d Monthly calendar with daily family activities Parent Academies in evening (4 a year), with free babysitting for children 3 and over Parent English classes at the Beebe, Ferryway, and Salemwood Schools Family Nights: Zumba, BINGO for books, Family Game Night
Variables to Consider/Research MCAS analysis: strengths and weaknesses by question types Time allotted for instruction Time of instruction: Does one group score higher than another Materials being used and how are they being used How much time are students spending reading across genre/subject area? How has this cohort of students done over time? Is the instruction aligned with the Common Core Standards?
2012 MCAS Results English Language Arts, Grades 6 through 10
Strengths Grade 10 (Aggregate) N=386 • Increase in the number and percentage of students at the Advanced (23% to 30%), (89,118) and Proficient Level (53% to 55%), (204 to 217) • Decrease in number and percentage of students at Needs Improvement (18% to 11%) (69 to 46) • Steady increase in CPI (90. to 93.6) Grades 6-8(Aggregate) • All schools at Level 1 and 2 Accountability and Assistance Level • All schools showed increase at the Advanced Level at different grade levels. • Three schools showed increase in the number of students at Proficient Level at different grade levels. Grade 6 (N=485) • Increase in Medium SGP from 55.0 to 63.0 • Increase in percentage of students at Advanced Level (9% to 13% Grade 7 (N=451) • Performance level on Writing Prompt above the state average (Topic Dev 7.02/6.92), (Conventions 6.75/6.71) Grade 8 (N=454) • Increase in CPI (89.6 to 91.6)
Challenges Increasing students’ abilities to meet new Common Core Standards that require them to • Make inferences about the relationship between details and the overall meaning of the text or author’s purpose • Analyze and evaluate how the author’s choices of organizational, syntactical, and literary choices influences the meaning of the text. • Construct and compose strong arguments in their writing about the elements and purpose of different texts and support their position with relevant evidence.
Next Steps • Establish stronger 6-12 alignment of instructional and assessment practices that with Common Core Standards. This includes • Professional development on pre-AP strategies that increase students’ understanding of the author’s purpose and rhetorical analysis • More integration of analysis in dialectical journals and during whole class and small group discussions. • Continued focus on quarterly writing prompts to monitor students’ progress in organizing their ideas and writing on demand. • Creation of a vertical team to align practice across grade levels. • Grade 6-8/ Use of Sentence Composing strategies to improve students reading and writing skills.
2012 MCAS Results Math
Strengths Student Growth Percentile is 55%. Highest in the 10 comparable districts: Lynn, Chelsea, Everett, Revere, Pittsfield, Boston, Chicopee, Brockton, Quincy, and Lowell Percentage of students Proficient and Advanced is 51% 3rd highest percentage in the 10 comparable districts Percentage of students in advanced increased by 10% Narrowed proficiency gaps. All grades have CPI above 70. Two grades have CPI above 80.
Challenges • Percentage of students in warning or failure still at 19% • Grade 5 growth is below state average of 50% • Geometry, Measurement, and Number Sense strands were below the state performance. • Inconsistency within grades
Next Steps • Five District Partnership for Curriculum and Assessment created common curriculum maps K-12 that are being implemented this year • Partnership with Andrew Chen, Edutron Corporation, for professional development workshop and visitations to support the implementation of Common Core Frameworks and PARCC Assessments • MTEL workshops for teachers attaining math certification 1-6 • DSAC partnership
2012 MCAS Results Science
Strengths 27 Steady increases in Advanced /Proficient performance levels and corresponding decreases in Needs Improvement/Failing for High School level Beebe, Ferryway, and Linden have also demonstrated similar trends for Grade 8 Science
Challenges 29 Level performance for grade 5, fluctuations observed from 2009 to 2012 Increase focus on science in the elementary grades Consistent curriculum across grade levels within the district
Next Steps – MS and HS 30 Increase rigor in the classroom through incorporation of LTF lessons (pre-AP) Vertical teaming to better align what students need to know and be able to do Professional development on the use of backward design (UbD) to develop unit/lesson plans
Next Steps – Elementary 31 Provide teachers with more time, more materials, and training Increases in frequency/time have occurred, new curriculum materials ordered, PD is planned
Looking Forward New Curriculum Framework Standards in place: MA Common Core Standards PPI – Progress and Performance Index - Combines information about narrowing proficiency gaps, growth, and graduation and dropout rates over multiple years into a single number. New ELL Framework Standards: WIDA (World-Class Instructional Design and Assessment) Transition from MCAS to PARCC