Download

1 / 31
310 likes | 439 Views
This article explores the evolution of capacity management in virtual environments, highlighting key shifts towards shared infrastructure and a dual-tier management approach. It distinguishes responsibilities between application and infrastructure teams, examining critical resources—including compute, storage, and networking. Emphasizing the importance of cultural adaptation, it also outlines effective VM-level and Infra-level management strategies to optimize performance and resource allocation while accommodating peak workload fluctuations. A practitioner's perspective sheds light on practical challenges and solutions in modern data centers.

E N D
Capacity Management in the Virtual World Singapore, Q1 2013
What changes in the virtual world • It’s a shared Infrastructure. • Apps Team or “Business” no longer own the infrastructure. • Bespoke system to standardized services • Emerging of 2-tierCapacity Management • VM level • Done by Apps team. • Infra level. • Compute, Storage, Network, Security, Datacenter • Done by DC Infra team. • It is not just technical • It is also cultural, social, political, or whatever you want to label it.
Changes in detail • Compute Resource • Dedicated becomes shared • Single server becomes Cluster • 2 node cluster (HA) becomes N+X cluster. • Emerging of Cluster as the smallest compute • Different cluster serves different purpose. • Network Resource • Access Switch completely virtualised • Storage Resource • 10% on central array become 100%. Sharing is 100% • Do you share the array for both virtual and physical servers? • Application • Licensing! • Affinity Rules
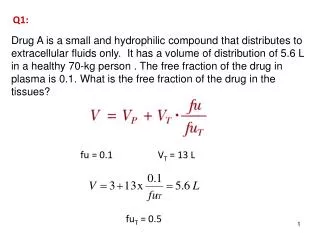
Capacity Managementat VM-level • Keep the building block simple • 1 VM - 1 OS - 1 App - 1 Instance • Size for PeakWorkload • A month-end VM needs to be sized based on the month-end workload • Examples: a VM has 2 peaks • Peak 1 uses 8 vCPU and 12 GB vRAM • Peak 2 uses 2 vCPUand 48 GB vRAM • Size is 8 vCPU, 48 GB vRAM. Yes, this is 75% buffer! • Size correctly • Over size results in slower performance in the virtual world. • No need to be rigid. Physical world constaint no longer apply • You can have 50 GB vRAM, no need to be 64 GB. • You can have 5 vCPU, no need 8 vCPU. • You can have 500 GB vDisk, no need 720. • It can always be increased. No downtime in certain OS.
Capacity Managementat VM-level • Monitor the following 5 components • vCPU • vRAM • vNetwork • vDisk: • IOPS (this is hard!) • Capacity • Use Reservation sparingly • Use Shares sparingly • Avoid using Limit
Capacity Management at Infra-Level • Get the Architecture correct • Wrong architecture makes management & operation unnecessarily difficult. • Always know the actual capacity of the physical resource • If you don’t know how many CPU or RAM the ESXi has, then it’s impossible to figure out how much capacity left. • With that…. do you know how many IOPS the Storage has? • Majority of shared storage is… well, shared. There are non ESXi servers mounting it. • You need to know the minimum, guaranteed IOPS for vSphere. • Once you know the Actual, figure out the Usable portion Capacity left for VM Raw Capacity IaaS “workload” Non vSphere workload
Capacity Management at Infra-Level: IaaS “workload” vSphere is more than hypervisor. Think Datacenter, not Server.
Capacity Management at Infra-Level: IaaS “workload” Use this setting in vCenter Operations 5.6 to cater for both the IaaS workload and VM Peak buffer
Capacity Management at Infra-Level: Compute • Example of tiering in cluster In the above example, capacity planning becomes much simpler in Tier 1, as we will hit the Availability limit before we hit Capacity limit. We still have to do Capacity Management at the VM-level though.
Example: Usable RAM calculation • In a cluster of 10 ESXi with N+1: • The Raw RAM is 1280 GB • The Usable RAM is 864 GB • Your capacity planning starts at 864 GB, not 1280 GB. • Lower if you are running Virtual Storage VM.
Example: Usable CPU calculation • In a cluster of 10 ESXi (16 cores, 32 theads) with N+1: • The Raw CPU is 160 cores (320 threads) • The Usable CPU is 135 “cores” • Lower if you are running Virtual Storage VM
Capacity Management at Infra-Level: Storage • Determine the actual architecture you use. Then calculate your Usable IOPS vSphere Cluster Backup VM ESXi 1 ESXi 2 ESXi 3 Backup Server Non ESXi ESXi 1 ESXi 2 ESXi 3 Storage Network (normally FC) Shared IP Network Distributed Storage Mirroring vSphere Replication. Non ESXi servers. Backup workload. Non VAAI workload. Array Replication. Shared Storage Backup Storage Storage 1 Storage 2 Storage 3
Example: Usable Storage calculation All numbers are pure estimate
Capacity Management at Infra-Level: Network Add picture of Network Traffic Add my network calculation
Estimated ESXi IO bandwidth in 2014 Disclaimer: future features may differ than what I put here.
Summary 1 2 3 Architecture Usable Capacity vCenter Operations • Get the architecture right • Compute • Storage • Network • Calculate the Usable Capacity • Non VMware workload • IaaS workload • VM workload Configure VC Ops accordingly - To be covered separately
Requirements: Reports & Analysis • What are our typical VMs profile? • Small, Medium, Large • How many more VMs can we put? • Based on our actual-workload VM • Based on theoritical/specified size VM • When do we need to buy additional capacity? • Compute • Storage • Network • Which VMs need to be right size? • Which VMs are basically dormant (idle VM?) • Which cluster is under heavy usage? Or not utilised? Core Questions (major impact) Non-core Questions
Determining a VM utilisation • There are 2 type of utilisation that must be captured • Average Utilisation for entire period • This is the average of all utilisation. Over time, this tends to be low unless the VM is busy more than 50% of the time. A VM will have low average if: • It is normally used during office hours (which is just ~40 hours per week) • It is cyclical in nature (e.g. month-end payroll processing, end of day batch job) • The Peak is much higher than the average, but only for a short burst. • Average Utilisation for Peak “period” only • This is the average of peak utilisation. Examples this could be • Average of Peak period (e.g. 1st day of the month) • Average of Top 10% utilisation. • In month-end job, this needs to be Top 3% as it’s 1 day in 30 days. • This is needed for Cyclical Workload • VM workload is cleaner than Physical Server workload • AV scan & backup are offload to hypervisor • Disk Defragmentationno longer required.
Managing cyclical workload • Example of cyclical workload • Daily batch run from midnite to 6 am. From 6 am to midnite it is idle. • In this case, even if it’s running 100%, the daily average will be just ~25% • End of month batch job. From 1st to 29th (or 30th) it is idle • In this case, even if it’s running 100% for entire day, the monthly average will be ~4% • Is the VM oversized? • No. The VM is right sized. • If we can know the Peak period, and only count for this period, we will know that the VM is not over-sized. • The key here is to determine this Peak period automatically. Setting the peak period for 1000s VM is prone to human error. Plus the workload can change. • Is the VM running out of Capacity soon? • No. The VM does not need to be given more resources. • To determine the Time Remaining, we need both Peak period and Total period. Doing Peak period alone will be misleading (as it will show that we need to give the VM more resource)
Actual VM distribution • Explanation: • vCPU is rounded up to the nearest digit as we cannot assign a slice of vCPU. • vRAM is rounded up the nearest digit. In reality we will rounded up to the nearest even number, or nearest 10s for large VM • 3 GB becomes 4 GB • 73 GB becomes 80 GB • vDisk GB is rounded up the nearest 10 GB. • vDisk IOPS is rounded up to the nearest 10 IOPS • vNetwork is rounded up to the nearest Mb. It will take 1000 VM to saturate 1 GE link.
How many VMs can we put? • Description • Actual-size VM means it is based on Actual workload or actual Reservation • vCenter Operations can take Reservation into account • Given-size VM means the value is entered manually by Administrator. • We might enter 4 vCPU, 16 GB vRAM, 400 GB vDisk as input, and see how many VM we can put • This is at cluster level, not host level. Cluster is the smallest logical building block. • Result above the cluster limit is shown as vSphere 5.1 cluster limit • This is showing what we can put now, not 6 months in the future (or other date)
When do we need to buy additional resource? • Description • Result rounded to the nearest days. Result above 1 year is shown as >1 year
Thank You The rest of the decks are still very draft.