
測定結果 (1)
測定結果 (1). 0deg での 電圧対磁束密度. -1V. 1V (0.897). 0V. -0.5V. 0.5V. 測定結果 - 磁気モーメント変換後. 0deg での電圧対磁気モーメント値. 測定結果 (2). まとめ. 6 本の磁気トルカ,それぞれにおいて電圧と磁気モーメントの間での線形性を確認し,これらの間の相関式を算出した.. 今後の課題. 姿勢制御ユニットの改良 ・指令電圧と印加電圧の誤差を小さくする. → もしくは誤差の少ないところのみを制御に使用. ( →今回は1のトルカ以外実際に測定された印加電圧の値を利用してグラフ化.)

測定結果 (1)
E N D
Presentation Transcript
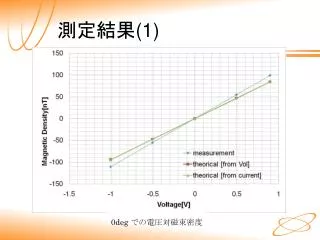
測定結果(1) 0deg での電圧対磁束密度
-1V 1V (0.897) 0V -0.5V 0.5V
測定結果-磁気モーメント変換後 0deg での電圧対磁気モーメント値
まとめ • 6本の磁気トルカ,それぞれにおいて電圧と磁気モーメントの間での線形性を確認し,これらの間の相関式を算出した.
今後の課題 • 姿勢制御ユニットの改良 ・指令電圧と印加電圧の誤差を小さくする. →もしくは誤差の少ないところのみを制御に使用. (→今回は1のトルカ以外実際に測定された印加電圧の値を利用してグラフ化.) 電圧のかけ始めに過剰電圧が流れる傾向が見受けられた.
実際の制御ステップの考察 ・電圧をかける前後の磁束密度の変化の変化時間と割合を詳しく測定する必要がある. →今回は電圧・電流計・制御ユニットと磁気センサのデータを収得するPCの間で時刻データのずれがあり,詳細な解析は難しい. • 理論式の改善 ・理論式と計測値からの値の間に,どのケースもほぼ一定の誤差がある. →理論式の方に誤差がある可能性が高い. →しかし,電流からと電圧からの理論値の間の誤差は少ない.