Download
1 / 42
420 likes | 442 Views
Health profiles and (mental) health indicators in Norway: Using the health information systems Heidi Lyshol Department of Health and Inequality. Overview. 2012 Act on Public Health Data sources Municipal, City District and County Public Health Profiles Norhealth and Municipal Databank

E N D
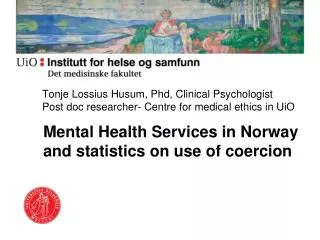
Health profiles and (mental) health indicators in Norway: Using the health information systems Heidi Lyshol Department of Health and Inequality
Overview • 2012 Act on Public Health • Data sources • Municipal, City District and County Public Health Profiles • Norhealth and Municipal Databank • Public health report(Facts about • User surveys: what do the municipalities think?
19 counties, 426 municipalities, 5 million inhabitants 385,252 square kilometres (148,747 sq mi)
New Act on Public Health January 2012 Purpose • Contribute to societal development that promotes public health and reduces social inequalities in health. • Ensure that municipalities, county authorities and central government health authorities implement measures and coordinate their activities in the area of public health in a proper and adequate manner • Facilitate long-term, systematic public health work.
New Act on Public Health January 2012 • Norwegian counties and municipalitiesrequired to have sufficientoverview over healthconditions and influencingfactors
Central point of the PH Act: § 5 Overview based on: a: Information made available by central health authorities and the county b: Information from municipal health and care services c: Knowledge about factors and trends in the environment and local community that may affect the health of the population Norwegian Institute of Public Health |
Main data sources: Registries (person identifiable) • Cause of Death Registry • Norwegian Patient Registry • Cancer registry of Norway • Medical Birth Registry of Norway • Childhood Vaccination Registry • Norwegian Prescription Database • The Registry of the Norwegian Armed Forces • Registries at Statistics Norway • Norwegian Labour and Welfare Administration • Norwegian Directorate for Education and Training • Water Works Registry
The 17 National Health Registries…
…and 50 + Quality Registries… (rarely useful for this purpose)
Other data sources Health surveys (mainly by phone; Statistics Norway) State payment system for GPs and primarycare (KUHR/KPR) School surveys Populationrecordsof different kinds
Criteria for selecting indicators: • Valid & reliable methods for measurement • Nationally/regionally representative data • Easy to understand • Available • Measured regularly • Preferably on ECHI-shortlist (see European Core Health Indicators; http://ec.europa.eu/health/indicators/echi/list/index_en.htm)
Process • Indicator selected and collected • Indicator standardised (age, gender etc) • Indicator put in MDB/NorHealth • Indicator extracted from databank for Public Health Profiles • Indicator extracted from databank for PH report
Public Health Profiles Main features More information on specific subjects, municipal figures Public health barometer and tables
Public Health Profiles • Inspired by • the Public Health Observatories, Great Britain • I2SARE
The PH Profiles contain: • Easily accessible information about the health of the population: • Interpreted statistics • Visual depictions • Public health barometer • Figures/diagrams • Chosen annual topics • 2017: antibiotic resistance, flu vaccinations 60+, drinking water quality/supply
Population background Population growth Percentage over age 80 Life expectancy, male and female Single person households Immigrants Living conditions Education level Low income Disability pensions 18 - 44 Children of single parents Environment Drinking water quality Injuries/accidents Schools Pupils enjoying school Bullying in schools Reading ability Percentage high school drop-outs Health determinants Smoking in women Overweight in male recruits Health and illness Mental symptoms/illness, primary care Mental illness, medication High blood pressure, primary care Cholesterol lowering drugs Cardiovascular disease, hospital data COPD/asthma, medication Diabetes 2, medication Diabetes 2, primary care Cancer, new cases in total Cancer of the bowel, new cases Hip fractures, hospital data Musculoskeletal symptoms, primary care Vaccination coverage, MMR, 6-year-olds Indicator overview (Municipal PHP) 2015
Populationbackground Populationgrowth People livingalone, 45+ Participationelection 2015 Livingconditions Educationlevel Lowincome Disabilitypensions 18 - 44 Childrenof single parents Income inequality Unemployment 15 - 29 Environment Drinking water quality Injuries/accidents Loneliness, Satisfiedlocalenvironment, Memberorganisation (school survey) Schools Pupilsenjoyingschool Reading, Mathematicsability Percentagehighschooldrop-outs Health determinants Smoking in women Overweight(all) recruits Physicallyinactive (school s.) Alcoholuse (school s.) Health and illness Life expectancy m/f (moved) Educationaldifferencelifeexp. Mental symptoms/illness, primarycare(15-29) Mental illness, medication Cardiovasculardisease, hospital data Diabetes 2, medication Lung cancer, new cases in total Musculoskeletal symptoms, primarycare Vaccinationcoverage, measles, 9-year-olds Indicator overview (Municipal PHP) 2016
Population background Population growth People living alone, 45+ Population 80+ Living conditions Education level Low income Disability pensions 18 - 44 Children of single parents Income inequality Environment Drinking water quality/supply Injuries/accidents Loneliness, Satisfied local environment, Member organisation (school survey) Schools Pupils enjoying school Reading, Mathematics ability Percentage high school drop-outs Health determinants Smoking in women Overweight (all) recruits Physically inactive (school s.) Alcohol use (school s.) Health and illness Life expectancy m/f Educational difference life exp. Satisfied own health, youth survey Mental symptoms/illness, primary care (15-29, all users) Mental illness, medication Cardiovascular disease, hospital data Diabetes 2, medication Lung cancer, new cases in total Musculoskeletal symptoms, primary care Vaccination coverage, measles, 9-year-olds Indicator overview (Municipal PHP) 2017
The barometer: ~ 34 indicators Shows municipality (etc) compared to the country, other municipalities in the same county, the spread of results in the county, and whether something is good, bad or neutral.
Significantly better than the country for this year or these years Significantly worse than the country Not significantly different (often due to population size/selection) Significantly different from the country Not tested for statistical significance County average Norwegian average Spread between this county’s municipalities The ten best municipalities in Norway
Presentation systems: Public Health Profiles Databanks
Inspired by WHO’s HfA Database http://data.euro.who.int/hfadb/
History NorHealth/Municipal Databank 1999 (autumn): Decision to have presentation system: Norgeshelsa. Steering group formed. 2000: Selection of indicators, writing metadata, entering data. Downloadable system only. 200+ indicators. Introduction conference April 2000. 2001: English translation: NorHealth. 2002: Online plus downloadable system. 2003: Downloadable system removed. Fewer, but better indicators selected. 2004 – 2012: Small revisions, ECHI collaboration. Other NIPH databases following our lead. 2012: Municipal databank added. 2013-14: Revision NorHealth to increase resemblance NorHealth/Municipal databank.
Online Municipal Databank Indicators at municipal level Can create own tables and figures Can compare municipalities with counties and country Metadata – information about the data (http://khs.fhi.no)
Online Municipal Databank Velg geografi Select indicator Select municipality
Municipal Databank – severalchoices Type of medicine Year Population groups Geography
Female users of anti-depressants, all municipalities in Møre og Romsdal
Developments over time? By gender? Age groups? Same pattern rest of the country?
Norhealth (www.norgeshelsa.no) In English!
Psychological distress, by gender, 16-24, 25-44, 45-64 and 65-79, EHIS 2012 men women
Metadata • Important to publish metadata with each indicator: • Indicator definition • Population • Units of measurement • Data source • Data collection • Data quality
Public Health Report (Fact sheets) • The NIPH website (www.fhi.no) has around100 fact sheets describing health conditions, illnesses and risk factors (half translated into English) • Information on: • incidence and/or prevalence in Norway • trends over time • international comparisons • research from Norwegian Institute of Public Health • sources/literature • Fact sheets use data from Norhealth where possible • Direct linkage to data bank -> always updated figures • Fact sheets more hits than Norhealth (visible from search engines) • Selected Fact sheets + introduction: Public Health Report! • New format: Facts about…
Roughly follow EUphact model • Definition & scope • Reason for inclusion • Occurrence • Consequences for individual & society • Causes & risk factors • Data sources & quality • References
Who are our users, and how do we communicate? • Municipalities, counties (ref 2012 Act on PH) • Web pages, reports, articles • (Subscription) newsfeeds • Annual reminders, incl. to newspapers • Annual county tours • Conferences and meetings; exhibitions • Courses at MPH level + anywhere they invite us
What do the users think? • User surveys (municipal PH coordinatorsetc): • 2014 (qualitative (13 interviewed)) and quantitative (219 respondents)) • 2016 (quantitative (264 respondents) • very positive towardsMPFs, veryuseful for municipal planning • usersneed more indicatorsaboutabsolutelyeverything • whycan’t NIPH provideindicators for thesmallestmunicipalities • usingthe databanks is easy, thoughmapsaretricky (butsomehaven’ttriedthe databanks at all => more courses) • THANKS for telling theusersabouttheother parts ofthetoolset
Summing up: the presentation tools of the NIPH • Municipal public health profiles • City district public health profiles • County public health profiles • Municipal statistics bank • Norhealth • Public Health Report (Facts about…) • Statistics calendar
What kind of mental health indicators are available? • Prescription medicine (registry) • Use of primary health care (reimbursements) • Psychological distress (survey) • Social support (survey) • Someone to confide in (survey) • School surveys: • bullying, loneliness, close friend