Isotopic and Elemental Mapping in V. cholerae Cells via EL-FISH NanoSIMS Imaging
This study showcases NanoSIMS imaging of 13C-labeled V. cholerae cells post fluorine-labeling with EL-FISH. It includes hybridization with general Bacteria probe EUB338-I, tyramide signal amplification, and controls. The distribution and abundance of 13C and 19F relative to 12C are depicted, with APE atom percent enrichment. Supplemental data Figure 2 demonstrates probe mismatch controls using Bacillus subtilis and Pseudomonas aeruginosa cells post EL-FISH, with fluorescence and NanoSIMS images, secondary electron images, and relative abundance of 19F to 12C after hybridization with probe CF319a. Color bars indicate the relative isotopic/elemental enrichment/abundance in the images.

Isotopic and Elemental Mapping in V. cholerae Cells via EL-FISH NanoSIMS Imaging
E N D
Presentation Transcript
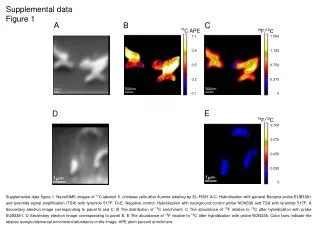
Supplemental data Figure 1 A B C 13C APE 19F/12C 1.1 1.500 0.8 1.125 0.5 0.750 0.2 0.375 -0.1 0 E D 19F/12C 0.100 0.075 0.050 0.025 0 Supplemental data figure 1. NanoSIMS images of 13C-labeled V. cholerae cells after fluorine-labeling by EL-FISH. A-C. Hybridization with general Bacteria probe EUB338-I and tyramide signal amplification (TSA) with tyramide 517F. D+E. Negative control. Hybridization with background control probe NON338 and TSA with tyramide 517F. A Secondary electron image corresponding to panel B and C. B The distribution of 13C enrichment. C The abundance of 19F relative to 12C after hybridization with probe EUB338-I. D Secondary electron image corresponding to panel E. E The abundance of 19F relative to 12C after hybridization with probe NON338. Color bars indicate the relative isotopic/elemental enrichment/abundance in the image. APE atom percent enrichment.
Supplemental data Figure 2 A B C 19F/12C 0.10 0.07 0.05 0.02 10μm 0.00 D E F 19F/12C 0.10 0.07 0.05 0.02 10μm 0.00 Supplemental data figure 2. Probe mismatch controls. Fluorescence and NanoSIMS images of Bacillus subtilis (A-C) and Pseudomonas aeruginosa (D-F) cells after EL-FISH. A+D. Positive control. Fluorescence images after hybridization with general Bacteria probe EUB338-I and tyramide signal amplification (TSA) with tyramide 517F. B+E. Secondary electron images. C+F. Mismatch control. Relative abundance of 19F-fluorine to 12C-carbon after hybridization with probe CF319a and TSA with tyramide 517F. Color bars indicate the relative elemental abundance in the image.