Download
1 / 23
230 likes | 565 Views
Lyme Disease in Texas? Enhancing Prevention Through the Identification of Areas of Risk . Susan Swinson-Williams . GEOG 596A Capstone Proposal Penn State MGIS Program Advisor : Dr. Justine Blanford. Agenda. Overview What is Lyme disease? Lyme in Texas Objectives Methods

E N D
Lyme Disease in Texas?Enhancing Prevention Through the Identification of Areas of Risk Susan Swinson-Williams GEOG 596A Capstone Proposal Penn State MGIS Program Advisor: Dr. Justine Blanford
Agenda Overview What is Lyme disease? Lyme in Texas Objectives Methods Anticipated Outcomes Other Potential Applications Timeline Acknowledgements References Questions / Comments
Many doctors believe that “we don’t have Lyme in Texas.” • Many Texans travel out of state for diagnosis and treatment. • Prevention and education are the best approaches against Lyme disease • Prevention and education efforts could improve if we determined where humans may be at greatest risk Overview
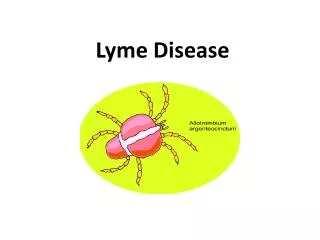
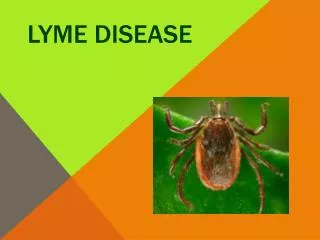
What is Lyme disease? • An infection caused by a corkscrew-shaped spirochete bacterium • Most common vector-borne disease in U.S.A. • Transmitted through bite of an infected tick Dr. Burgdorfer, seen here inoculating ticks. Credit: NIAID/RML Erythema migrans rash (Source: Wikipedia). Darkfield microscopy photomicrograph, magnified 400x, of bacteria Borrelia burgdorferi (CDC, 1993).
Transmission and Distribution Ticks are quite small, no bigger than a pinhead in the larval and nymphal stage Their size enables them to feed on hosts unnoticed Three things necessary for Lyme transmission: the Lyme bacteria, the ticks that can transmit the bacteria, the hosts that serve as a meal for the ticks
Transmission and Distribution The enzootic cycle of Borrelia burgdorferi (Source: Radolph, Caimano, Stevenson, & Hu, 2012).
Transmission and Distribution Confirmed Lyme disease cases by month of disease onset in the United States from 2001-2010 (Source: CDC, 2013a).
Diagnosis and Quality of Life Respondents reporting Fair or Poor health as a function of time until diagnosis (Source: Johnson et al., 2014).
Diagnosis and Quality of Life Respondents reporting Fair or Poor health compared to the general population and patients with other chronic illnesses (Source: Johnson et al., 2014).
Why Does Texas Need A Risk Map? • The few maps that exist on this subject are either • - Inaccurate or outdated • - not very specific • - or all of the above Reported Cases 1990-2008 This 2012 ‘Risk Map’ doesn’t even show the entire USA nor correlate with numbers of Lyme disease cases reported by the CDC. We can do better than this, right? (Yale School of Public Health, 2012) The CDC admits that approx. 90% of cases go unreported, so these figures are quite a bit lower than reality. (LDA, 2012)
Why Does Texas Need A Risk Map? Lyme continues to spread due to migratory animals, development, reforestation, and climate change. Multiple tick species exist in the U.S., some of which have overlapping distributions. Approximate distribution of three vector tick species in the U.S. (Source: Bakken et al., 2006). Many animals serve as blood hosts for feeding ticks. (Source: Levy, 2013)
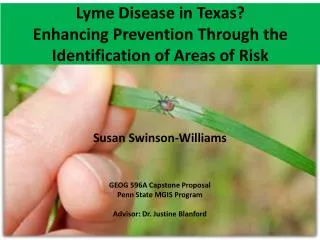
Lyme Disease in Texas • Previous research indicated that 1 to 4% ticks tested in every public region of Texas were infected with Borrelia burgdorferibacteria (TXLDA, 2014). • Recent research, however, found Borrelia infection in 45% of Ixodes ticks collected from 20 counties in Texas and regions of northeastern Mexico (Feria-Arroyo et al., 2014).
Objectives • Map prevalence of Lyme disease in Texas by: • analyzing known distribution of reported human cases in Texas • survey of Texas residents with Lyme disease to establish human incidence within the state. • Identify potential risk areas through habitat mapping of the vector.
Methods To improve awareness of the prevalence of Lyme disease in Texas • Analyze existing reports from data reported to CDC (between 2002 – 2011) to determine areas in Texas that have highest reporting/Lyme disease. • Collect data via voluntary survey to determine current incidence of human Lyme disease. Questions will include: illness length, co-infections, diagnosis procedures, diagnosis was in state and other relevant data that are HIPAA-compliant. • Statistically significant areas of Lyme Disease will be identified using Exploratory Spatial Data Analysis (e.g. GeoDa)
Methods • Identify potential risk areas • through habitat mapping of the vector
Methods – the NDVI • Normalized Difference Vegetation Index (NDVI) = • a ratio of near-infrared (NIR) to red light. • Healthy or dense vegetation = • high positive NDVI • Unhealthy or less dense vegetation = • lower positive NDVI • Water = negative NDVI
Methods • Identify potential risk areas • through habitat mapping of the vector • Create a risk map • highlighting low to high risk areas
Anticipated Outcomes • An updated map delineating the current extent of Lyme disease incidence in Texas based on (i) tick habitats and (ii) reported cases/survey. • Create a risk map highlighting low to high risk areas • Determine the correlation of Lyme disease with land use/habitat. • Provide recommendations
Other Potential Applications Risk mapping can address Lyme in other neglected regions both in the U.S. (Virginia, Georgia, Louisiana) and other nations (Canada, Mexico, Caribbean, Australia). Similar techniques can address other vector-borne diseases, which are the focus of the World Health Organization’s 2014 theme. • 1,000,000+ die from VBD per year. Many more are left with chronic illness and disabilities . • 50%+ of the world’s population is at risk. Travel, trade and migration is increasing that number. • Diseases also a serious impediment to poverty reduction and socioeconomic development.
Timeline Peer Review Presentation & Feedback 5/8/2014 Make suggested revisions based on peer feedback 5/15/2014 Abstract Submission: URISA’s 52nd Annual Conference 7/21/2014 Abstract Submission: TX Natural Resources Information System 27th annual Texas GIS Forum Institutional Review Board (IRB) Training 7/25/2014 Abstract Submission: ESRI Health GIS 8/1/2014 5/31/2014 Compile & Analyze Survey Results 8/6/2014 Launch Survey Statewide Final Draft & Advisor Review 6/4/2014 8/30/2014 Aug Oct Jun May Nov Apr Sep Jul Dec Fall Term 2 Fall Term 1 Summer Term 2014 Create potential risk map based on habitat data 9/8 to 9/11/2014 Abstract Submission: Applied Geography Conference Applied Geography Conference 10/15 to 10/17 TNRIS 27th annual Texas GIS Forum 5/19/2014 10/20 to 10/24 6/6/2014 URISA’s 7th Caribbean Conference 10/27 to 10/30 ESRI Health GIS 11/3 to 11/5
Acknowledgements Very great appreciation to my advisor, Dr. Justine Blanford, for her professional guidance, useful critiques, and patient assistance in keeping my project focused and on schedule. Also, special thanks to: Anna E. Berman Phyllis Shaw Patricia Ricks and the Texas Lyme Disease Association
Questions? “It’s tick season again!”