Download
1 / 25
250 likes | 452 Views
Development of the air pollution forecast system VENUS and its validation (in Japan). Seiji SUGATA * , Toshimasa OHARA ( National Institute for Environmental Studies) Jun-ichi KUROKAWA ( Japan Environmental Sanitation Center ) Masamitsu HAYASAKI (Toyama University ).

E N D
Development of the air pollution forecast system VENUS and its validation(in Japan) Seiji SUGATA*, Toshimasa OHARA (National Institute for Environmental Studies) Jun-ichi KUROKAWA(Japan Environmental Sanitation Center) Masamitsu HAYASAKI (Toyama University) VENUS (Visual atmospheric ENvironment Utility System) • Introduction • System outline • 2.1 User interface • 2.2 System core (thanks to prof. Byun) • 2.3 Configurations • 3. Validation
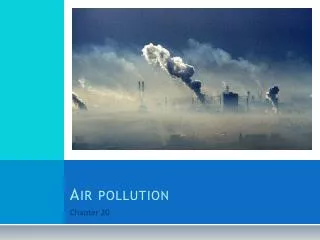
Needs for air pollution forecast system in Japan 【photochemical oxidant】 ・rise of concentration (particularly in western Japan) in decades and extension of high concentration area recently ・possible cause = long-range transport 【PM2.5】 ・air quality standard for PM2.5 was enacted in 2009 (only SPMbefore that since 1973) 35ug/day 15ug/year 【public concern】 ・increase of public concern about atmospheric environment (but, next to the radiation dose from food and soil since this year) 【local governmental officers】 ・Need information to issue a warning (difficult with increasing influence of long-range transport) → NIES has been developing a forecast system that includes the influence of long-range transport and has horizontal resolution for urban scale pollutions
VENUS user interface: top page Six areas in Japan Click area name to see forecast in the area Public release May.2010 Apr. 2008 Jun. 2009 Jun. 2009 May.2010 Jun. 2009 Japan East Asia
VENUS user interface: Each area page Species for public is now photochemical Ox and NO2. Sulfate aerosol in planning. ↑ Can choose hourly on the day and the next ↑ animation display ↑ simultaneous display for one day ↑ download Ox NO2
VENUS(Visual atmospheric Environment Utility System) Features and Specification • combination of Met. model RAMS +air quality model CMAQ
VENUS Core: Coupling of RAMS +CMAQ and VENUS development history Idea: Prof. Itsushi UNO and prof. Daewon Byun in mid 1990s Interface (MCIP for RAMS) development: since 1999 I stayed EPA/NERL for 1 year (1998-99) to develop it with supervised by Daewon MCIP for RAMS has been developed: up to RAMS 4.4 and CMAQ 4.4 but no update recently VENUS development: since 2004 Jointly developed by ・Ministry of the Environment ・Central Res. Inst. of Electric Power Industry ・local government environ. institutes Assisted by ・Fujitsu FIP corporation ・Japan Weather Association internal use/test Public open 2008 for Asia-Japan-greater Tokyo area 2009 other 2 areas 2010 other 3 areas
VENUS(Visual atmospheric Environment Utility System) Features and Specification • combination of Met. model RAMS +air quality model CMAQ • nudging with GPV weather forecast data by Japan Met. Agency • Emissions: EAGRID (in Japan)and REAS(others in Asia)
Input (everyday) Flowchart of VENUS JMA weather forecast data wind, temp., humid. Input (fixed) Input(month, weekday/end) Topography, Surface data Emission data EAGRID & REAS RAMS (Regional Atmospheric Modeling system) (Colorado State Univ.) MCIP for RAMS CMAQ (Community Multiscale Air Quality modeling system) (U.S.A. EPA) advection, diffusion, radiation, surface process, large scale condensation, cumulus convection,,,, wind, temp., pres., water vapor, precipitation, cloud water, soil water,,, advection, diffusion, cumulus convection, gaseous/aqueous reactions, aerosol reaction, dry/wet depositions,, Visualization VENUS HP Figures Concentration deposition Output (figures) Output(data)
VENUS(Visual atmospheric Environment Utility System) Features and Specification • combination of Met. model RAMS +air quality model CMAQ • nudging with GPVweather forecast data by Japan Met. Agency • Emissions: EAGRID (in Japan)and REAS(others in Asia) • 3 level nesting to cover East Asia region into urban areas in Japan • East Asia 100km⇔Japan 25km ⇔ each local area 5km
3 level nested domain: Asia (100km) – Japan (25km) – Each area (5km) 100km mesh 25km mesh Fukushima Tsukuba Colors in maps=NOx emission Dots=air pollution monitoring stations Tokyo
VENUS(Visual atmospheric Environment Utility System) Features and Specification • combination of Met. model RAMS +air quality model CMAQ • nudging with GPVweather forecast data by Japan Met. Agency • Emissions: EAGRID (in Japan)and REAS(others in Asia) • 3 level nesting to cover East Asia region into urban areas in Japan • East Asia 100km⇔Japan 25km ⇔ each local area 5km • hourly concentration of Oxand NO2 on the day and the next day • update every 9 o’clock in the morning (local time) • on NIES supercomputer system (scalar system)
Schedule JMA/GPVdata (84hours forecast) Day -1 Day 0 Day 1 2 day forecast(48h) JMA calculation Calculated at night 3:00 9:00 <Local time> 9:00 15:00 20:00 <UTC> GPV data (weather forecast) acquisition Update HP
Validation of VENUS comparison of Ox in May and Aug. 2009 between the result of VENUS and the observation data at air pollution monitoring stations Comparison is made for the following three cases for four local domains in Japan
Four Domains For validation Colors in map=NOx emission Dots=air pollution monitoring stations Monitoring time for NO,NO2,Ox > 90% NO/NOx≦0.2
Comparison of horizontal distribution For high Ox event from 8th to 12th in May 2009 (Left:observation, Right: VENUS) 10 8/May 9 11
Ox concentration on May2009 Potential ozone(O3+NO2) Thick line: obs. Thin line: simulation (25km) Daytime peaks are not so bad But low conc. at nights terrible
Skill scores for prefecture mean hourly Ox between obs. and VENUS Japan domain (25km ) May 2009 Japan domain (25km ) Aug. 2009 Local domain (5km ) Aug. 2009 west 30 prefectures east Black:Correlation coefficient Red: NMB(obs. - cal.) Blue: NME
Skill scores for prefecture daily 95 percentile Ox between obs. and VENUS Japan domain (25km ) May 2009 Japan domain (25km ) Aug. 2009 Local domain (5km ) Aug. 2009 west 30 prefectures east Black:Correlation coefficient Red: NMB(obs. - cal.) Blue: NME
Summary ・ NIES and colleagues developed air pollution forecast system, VENUS. ・ validation for Ox so so reproducibility for daytime high concentration poor for low concentration at night Next work ・ All Japan one domain with 5km ・ Sulfate aerosol also public Future works ・ Models update(RAMS4.4+CMAQ4.4→WRF+CMAQ?) ・ emission update etc.
http://www-gis.nies.go.jp/ Environmental GIS HP