Download
1 / 5
70 likes | 139 Views
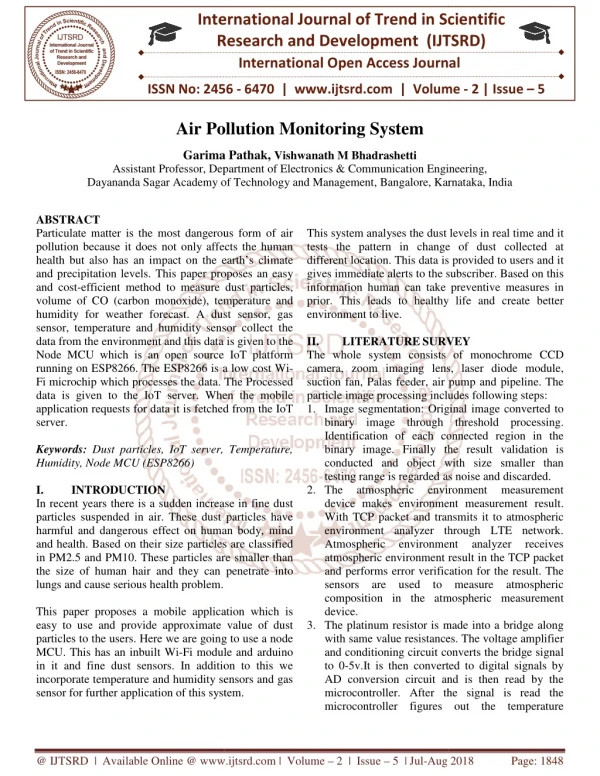
Particulate matter is the most dangerous form of air pollution because it does not only affects the human health but also has an impact on the earth's climate and precipitation levels. This paper proposes an easy and cost efficient method to measure dust particles, volume of CO carbon monoxide , temperature and humidity for weather forecast. A dust sensor, gas sensor, temperature and humidity sensor collect the data from the environment and this data is given to the Node MCU which is an open source IoT platform running on ESP8266. The ESP8266 is a low cost Wi Fi microchip which processes the data. The Processed data is given to the IoT server. When the mobile application requests for data it is fetched from the IoT server. Garima Pathak | Vishwanath M Bhadrashetti "Air Pollution Monitoring System" Published in International Journal of Trend in Scientific Research and Development (ijtsrd), ISSN: 2456-6470, Volume-2 | Issue-5 , August 2018, URL: https://www.ijtsrd.com/papers/ijtsrd18191.pdf Paper URL: http://www.ijtsrd.com/engineering/electronics-and-communication-engineering/18191/air-pollution-monitoring-system/garima-pathak<br>

E N D
International Research Research and Development (IJTSRD) International Open Access Journal Air Pollution Monitoring System Garima Pathak, Vishwanath M Bhadrashetti Department of Electronics & Communication Engineering Dayananda Sagar Academy of Technology and Management, Bangalore, Karnataka, India and Management, Bangalore, Karnataka, India International Journal of Trend in Scientific Scientific (IJTSRD) International Open Access Journal ISSN No: 2456 ISSN No: 2456 - 6470 | www.ijtsrd.com | Volume 6470 | www.ijtsrd.com | Volume - 2 | Issue – 5 Air Pollution Monitoring System Garima Pathak Assistant Professor, Dep Dayananda Sagar Academy of Technology Electronics & Communication Engineering, ABSTRACT Particulate matter is the most dangerous form of air pollution because it does not only affects the human health but also has an impact on the earth’s climate and precipitation levels. This paper proposes an easy and cost-efficient method to measure dust particles, volume of CO (carbon monoxide), temperature and humidity for weather forecast. A dust sensor, gas sensor, temperature and humidity sensor collect the data from the environment and this data is given to the Node MCU which is an open source IoT platform running on ESP8266. The ESP8266 is a low cost Wi Fi microchip which processes the data. The Processed data is given to the IoT server. When the mobile application requests for data it is fetched from the IoT server. Keywords: Dust particles, IoT server, Temperature, Humidity, Node MCU (ESP8266) I. INTRODUCTION In recent years there is a sudden increase in fine dust particles suspended in air. These dust particles have harmful and dangerous effect on human body, mind and health. Based on their size particles are classified in PM2.5 and PM10. These particles are smaller than the size of human hair and they can penetrate into lungs and cause serious health problem. This paper proposes a mobile application which is easy to use and provide approximate value of dust particles to the users. Here we are going to use a node MCU. This has an inbuilt Wi-Fi module and arduino in it and fine dust sensors. In addition to this we incorporate temperature and humidity sensors and gas sensor for further application of this system. This system analyses the dust levels in real time and it tests the pattern in change of dust collected at different location. This data is provided to users and it gives immediate alerts to the subscriber. Based on this information human can take preventive measures in prior. This leads to healthy life and create better environment to live. II. LITERATURESURVEY The whole system consists of monochrome CCD camera, zoom imaging lens, laser diode module, suction fan, Palas feeder, air pump and pipeline. The particle image processing includes following steps: 1.Image segmentation: Original image converted to binary image through threshold processing. Identification of each connected region in the binary image. Finally the result validation is conducted and object with size smaller than testing range is regarded as noise and discarded. 2.The atmospheric environment device makes environment measurement result. With TCP packet and transmits it to atmospheric environment analyzer through LTE network. Atmospheric environment atmospheric environment result in the TCP packet and performs error verification for the result. The sensors are used to measure atmospheric composition in the atmospheric measurement device. 3.The platinum resistor is made into a bridge along with same value resistances. The voltage amplifier and conditioning circuit converts th to 0-5v.It is then converted to digital signals by AD conversion circuit and is then read by the microcontroller. After the signal is read the microcontroller figures out the temperature microcontroller figures out the temperature Particulate matter is the most dangerous form of air pollution because it does not only affects the human This system analyses the dust levels in real time and it tests the pattern in change of dust collected at on. This data is provided to users and it gives immediate alerts to the subscriber. Based on this information human can take preventive measures in prior. This leads to healthy life and create better earth’s climate and precipitation levels. This paper proposes an easy efficient method to measure dust particles, volume of CO (carbon monoxide), temperature and humidity for weather forecast. A dust sensor, gas nsor collect the SURVEY data from the environment and this data is given to the Node MCU which is an open source IoT platform running on ESP8266. The ESP8266 is a low cost Wi- Fi microchip which processes the data. The Processed The whole system consists of monochrome CCD camera, zoom imaging lens, laser diode module, suction fan, Palas feeder, air pump and pipeline. The particle image processing includes following steps: Image segmentation: Original image converted to ge through threshold processing. Identification of each connected region in the binary image. Finally the result validation is conducted and object with size smaller than testing range is regarded as noise and discarded. The atmospheric environment device makes environment measurement result. With TCP packet and transmits it to atmospheric environment analyzer through LTE network. Atmospheric environment atmospheric environment result in the TCP packet en the mobile application requests for data it is fetched from the IoT Dust particles, IoT server, Temperature, measure measurement In recent years there is a sudden increase in fine dust air. These dust particles have harmful and dangerous effect on human body, mind and health. Based on their size particles are classified in PM2.5 and PM10. These particles are smaller than the size of human hair and they can penetrate into analyzer analyzer receives receives cation for the result. The sensors are used to measure atmospheric composition in the atmospheric measurement This paper proposes a mobile application which is easy to use and provide approximate value of dust particles to the users. Here we are going to use a node The platinum resistor is made into a bridge along with same value resistances. The voltage amplifier and conditioning circuit converts the bridge signal 5v.It is then converted to digital signals by AD conversion circuit and is then read by the microcontroller. After the signal is read the Fi module and arduino sors. In addition to this we incorporate temperature and humidity sensors and gas sensor for further application of this system. @ IJTSRD | Available Online @ www.ijtsrd.com @ IJTSRD | Available Online @ www.ijtsrd.com | Volume – 2 | Issue – 5 | Jul-Aug 2018 Page: 1848
International Journal of Trend in Scientific Research and Development (IJTSRD) ISSN: 2456-6470 according to the algorithm and the result is displayed on the LCD screen. 4.Two optical aerosol spectrometers are placed between filter screen for measuring dust particle inflow and outflow through HVAC filters in real time. The filters having the sample dust particle are examined in the lab. III. METHODOLOGY Internet of Things is connection of several devices using internet. In this the data is stored in cloud. IoT is a growing technology it allows connection of two or more devices into a single architecture. In our paper sensors are Dust Sensor, Gas Sensor, Temperature and Humidity Sensor, which are connected to Node MCU microcontroller so that they can communicate with each other using internet. A circuit is used to connect the fine dust sensor to the node MCU. Here Wi-Fi module and arduino module is inbuilt functions of node MCU. Node MCU is connected to the IoT cloud server. The data that is stored in the IoT cloud server is then sent to the android mobile application. Block diagram of the proposed air monitoring system is illustrated in figure1. ranges from 0-1023 of integer values. The raw signal is processed by the arduino code to format properly. The voltage value that is needed for calculating the dust density can be obtained by a signal value by multiplying by a factor 5.0/1024. Figure2. Fine Dust Sensor B.Gas Sensor : There are many types of gas sensors that are used to find different type of gases in the environment but the type of gas sensor used in this paper is MQ6 which senses carbon monoxide (CO). When the gas comes in contact with sensor and interacts, it creates potential difference on the element and this information is sent to processing unit. Gas concentration rises as the sensors conductivity becomes higher, therefore simple electro circuit is used. Figure3. Gas Sensor Figure1. Block Diagram C.Temperature and Humidity Sensor: DTH11 is the sensor that gives digital output of temperature and humidity. DTH11 includes negative temperature coefficient measurement devices and resistive sense of wet components and these are connected with 8-bit microcontroller. This sensor can be easily connected and provides real time data. The surrounding air is measured by humidity sensor and a thermistor that gives a digital signal on the data pin. It is simple to use but it needs time to analyze the data. A.Dust Sensor : The dust sensor model used in this paper is GP2Y1010AU0F. Dust Sensor is connected to an arduino through the circuit board. Fine dust concentration is measured by the sensor based in the optical sensor system. The size of observed particles from the sensor can be of at least 0.8µm. Data from the analog input is collected by the arduino and fine dust concentration is processed. Analog signal Input @ IJTSRD | Available Online @ www.ijtsrd.com | Volume – 2 | Issue – 5 | Jul-Aug 2018 Page: 1849
International Journal of Trend in Scientific Research and Development (IJTSRD) ISSN: 2456-6470 FLOWCHART: Figure4. Temperature and Humidity Sensor D. Node MCU: Node MCU (ESP8266) is a designing board where Wi-Fi module and arduino module is inbuilt. It is an open source platform, Interactive, Programmable, Smart and Wi-Fi enabled. It collects the data from the sensors for processing the received data. The processed data is sent to the IoT cloud server where the data is stored. IoT cloud server connects to the database and arduino serial is opened. Figure6. Flow Chart The logic followed in this paper is mean weighted average of the values obtained from the IoT smart devices i.e. sensors. The values collected from each of these sensors are arranged as separate packets. These packets in the form of documents are stored in the private cloud along with the specific time of upload. Data from each of these sensors are grouped as tuples containing 10 data at a time and are subjected to the main logic of the program. This logic decided whether the data should be retained in the private cloud or pushed to the public cloud for third party usage. Mean weighted average of the data in the form of tuples from each individual sensor is obtained. Now individual sensor values are compared with their corresponding mean weighted average value. If the individual sensor value is less than the mean weight average (or vice versa depending on the need of the application), then it is retained in the private cloud Figure 5.NodeMCU E.Mobile Application for Android: To communicate with the IoT cloud server mobile application for android is designed to receive the data through network socket. The data can be retrieved in real time from the cloud server that allows users to check current dust particles, gas, and temperature and humidity levels. By pressing a refresh button recent data is displayed on the home screen. @ IJTSRD | Available Online @ www.ijtsrd.com | Volume – 2 | Issue – 5 | Jul-Aug 2018 Page: 1850
International Journal of Trend in Scientific Research and Development (IJTSRD) ISSN: 2456 International Journal of Trend in Scientific Research and Development (IJTSRD) ISSN: 2456 International Journal of Trend in Scientific Research and Development (IJTSRD) ISSN: 2456-6470 else it is pushed to the aws (public cloud). Data from aws can be used by the third party for various applications. IV. TEST RESULTS ANS GRAPHS A. Unit testing Unit testing is shown below. Sl. No Vary the dust particle in environment and observe the changes in dust density. Determine the gas in the environment and observe the changes. Vary the temperature in environment by using heat and observe the increased temperature. Vary the humidity in environment and observe the increased or decreased humidity. oud). Data from aws can be used by the third party for various TEST RESULTS ANS GRAPHS: Unit testing is shown below. Figure (c): Temperature Sensor test result (c): Temperature Sensor test result Sensors Planned test Result Dust density is increased or decreased and output is shown in figure (a). CO Gas is sensed and output is shown in figure (b). 1 Dust Figure (d): Humidity Sensor test result (d): Humidity Sensor test result B. System testing IoT cloud server is created to get the updated the server. We get the data into the IoT thing speak server from the hardware module. By varying all sensors data behavior we get different values of data and the data is checked in different places. All sensors real data is updated in real time in V. CONCLUSION Here we are going to conclude that fine dust monitoring system is designed using different sensors for indoor and outdoor air quality monitoring. Three sensors are designated in the system for monitoring different parameter from environment. We got the temperature and humidity parameter, gas parameter like level of hazardous gas CO, NO, etc. and dust density from Environment by using temperature sensor, Gas sensor and dust senor respectively. The real data from sensors in IOT server and hence human society will be taken precaution for their better life. With the help of this system People can get all real time environment data from different area and they can schedule their life according to it. Here each module is tested and got the proper result from all modules according to environmental change. We have taken the record data and all data are available in IOT server. Hence the system is very useful for better life of human being and helpful for society precaution. 2 Gas IoT cloud server is created to get the updated data in the server. We get the data into the IoT thing speak server from the hardware module. By varying all sensors data behavior we get different values of data and the data is checked in different places. All sensors real data is updated in real time in thing speak server. Temperature is increased and output is shown in figure (c). 3 Temperature Here we are going to conclude that fine dust monitoring system is designed using different sensors for indoor and outdoor air quality monitoring. Three sensors are designated in the system for monitoring ter from environment. Humidity is increased and output is shown in figure (d). 4 Humidity We got the temperature and humidity parameter, gas parameter like level of hazardous gas CO, NO, etc. and dust density from Environment by using temperature sensor, Gas sensor and dust senor respectively. The real data from sensors are updated in IOT server and hence human society will be taken precaution for their better life. With the help of this system People can get all real time environment data from different area and they can schedule their life according to it. Figure (a): Dust Sensor test result (a): Dust Sensor test result module is tested and got the proper result from all modules according to environmental change. We have taken the record data and all data are Hence the system is very useful for better life of human being and helpful for society for taking Figure (b): Gas Sensor test result (b): Gas Sensor test result @ IJTSRD | Available Online @ www.ijtsrd.com @ IJTSRD | Available Online @ www.ijtsrd.com | Volume – 2 | Issue – 5 | Jul-Aug 2018 Page: 1851
International Journal of Trend in Scientific Research and Development (IJTSRD) ISSN: 2456 International Journal of Trend in Scientific Research and Development (IJTSRD) ISSN: 2456 International Journal of Trend in Scientific Research and Development (IJTSRD) ISSN: 2456-6470 3.Wang Shaozhi, Liu Jian, Zhang Linghua and Chen Huanan “Research on Measurement System”, 11th IEEE International Conference, 2013. 4.Jung Hee Jang, Li Kun and Young Min Jo” Fine dust control by HVAC in Seoul Metro Subway”, ICROS-SICE International Joint Conference, August 18-21, 2009. REFERENCE 1.Zhang Lu and Yan Young “On Measurement of Fine Dust through Digital Imaging”, IEEE International Conference, 24 November 2015. 2. Seung Ho Kim “Development of an IoT Atmospheric Environment Monitoring System”, IEEE International , Zhang Linghua and Chen on Zhang Lu and Yan Young “On-line Size Measurement of Fine Dust through Digital Imaging”, IEEE International Conference, 24-25 “Research Rapid Rapid Temperature Temperature Measurement System”, 11th IEEE International Jung Hee Jang, Li Kun and Young Min Jo” Fine dust control by HVAC in Seoul Metro Subway”, SICE International Joint Conference, Seung Ho Kim “Development of an IoT-based Atmospheric Environment Monitoring System”, IEEE International Conference, Conference, 2017. 2017. @ IJTSRD | Available Online @ www.ijtsrd.com @ IJTSRD | Available Online @ www.ijtsrd.com | Volume – 2 | Issue – 5 | Jul-Aug 2018 Aug 2018 Page: 1852