Statistical Tools
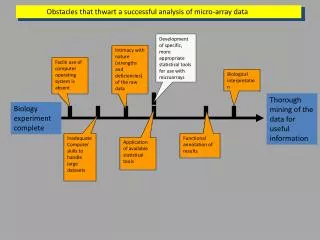
This document discusses advanced statistical techniques for analyzing microarray data, especially in scenarios where the number of features exceeds the number of samples (p >> n). Traditional algorithms fall short, making simple, comprehensible methods essential for extracting significant features. It highlights significance analysis relying on permutation distributions, providing false discovery rates (FDR) to quantify errors in gene significance. Additionally, it covers prediction methods, software tools for ease of use, and addresses important references that contribute to this field of study.

Statistical Tools
E N D
Presentation Transcript
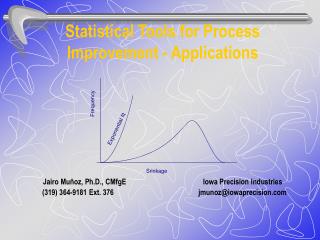
Statistical Tools Balasubramanian Narasimhan, Data Coordinating Center Joint with Division of Biostatistics Stanford University
Microarray Data Analysis • Number of features greater than number of samples (p >> n) • Traditional statistical algorithms cannot be used • Simple, easily understood approaches are preferable • Goal is to extract a small number of meaningful features • Need a way to quantify errors in deciding which features are significant
Signficance Analysis of Microarrays • Relies on a permutation distribution as a reference distribution • Compared observed t-like statistic with expected statistic values from the permutation distribution to decide which genes are significantly differentially expressed • Unified theory handles all kinds of response: two-class, multi-class, censored data, paired data • Provides False Discovery Rates (FDR) to quantify errors in genes called significant
False Discovery Rate • Traditional approach to multiple hypothesis testing is a Bonferroni-type adjustment • FDR tells you what proportion of your genes called significant might actually be false positives. An FDR is 5% means out of 100 genes called significant, 5 of them could be false positives. • Just as p-values measure false positive rates, q-values (J. Storey) measure FDRs.
SAM and FDR • A p-value of 5 % means that among all null features, 5% will will meet the rejection criterion • A q-value of 5% means that among all features called significant, 5% will be false positives • SAM provides q-values
Prediction Analysis of Microarrays • Predict phenotype based on expression values • Algorithm is more general than the name implies • Utilizes shrunken centroids to select genes that characterize each class • Best illustrated with an example
Peak Probability Contrasts • Data arising from Time-of-Flight Mass spectrometry for measuring relative abundance of different sized proteins in a blood sample, a useful technological complement to microarrays • Several popular systems including MALDI (matrix assisted laser desorption/ionization) and SELDI (Surface enhanced laser desorption/ionization) • Existing algorithms: svm, trees ,boosting, genetic algorithms • Focuses on peaks in the spectra at least for initial analysis • Accounts for variation in the horizontal position and peak heights for the same biological peak • Gives a measure of importance for each peak • Filters out less significant peaks in a simple way • Provides FDR estimates
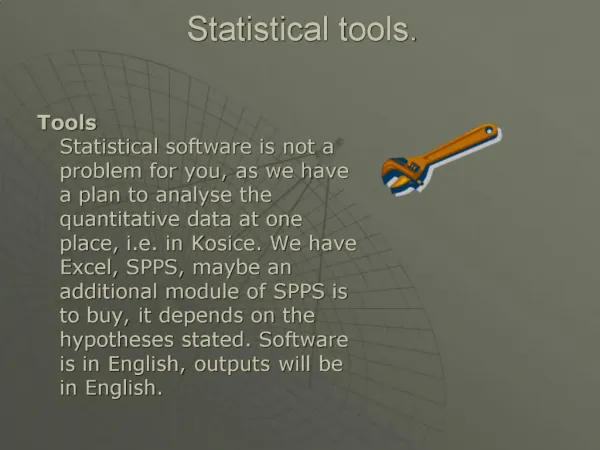
Software • We firmly believe that easily available and usable software is important • We therefore develop tools that are embedded in very common applications like Excel as many people seem to like the idea • Many of our tools are freely available on the web for download. (PPC will soon be on the list).
References • J. Storey & R. Tibshirani. Statistical significance for genome-wide studies, PNAS 100: 9440-9445 • R. Tibshirani, B. Narasimhan, T. Hastie, G. Chu. Diagnosis of multiple cancer types by Shrunken Centroids of Gene Expression, PNAS 2002 99:6567-6572 (May 14) • PPC paper to appear in Bioinformatics.


![Seven Quality Tools [Statistical Process Control]](https://cdn3.slideserve.com/6416179/seven-quality-tools-statistical-process-control-dt.jpg)