Download

1 / 20
260 likes | 583 Views
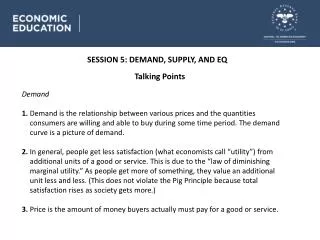
Session 5: Demand forecasting. Prof. Rama Deshmukh. Meaning Importance Methods. Why demand forecasting?. Planning and scheduling production Acquiring inputs Making provision for finances Formulating pricing strategy Planning advertisement. Steps . Specifying the objective

E N D
Session 5: Demand forecasting Prof. Rama Deshmukh
Meaning • Importance • Methods
Why demand forecasting? • Planning and scheduling production • Acquiring inputs • Making provision for finances • Formulating pricing strategy • Planning advertisement
Steps • Specifying the objective • Determining the time perspective • Making choice of method • Collection of data • Estimation and interpretation of results
QUALTITATIVE TECHNIQUES 1)EXPERT OPINION Delphi method. 2)SURVEY 3)MARKET EXPERIMENT Test marketing Controlled experiments. QUANTITATIVE TECHNIQUES 1)Time Series Analysis. 2)Barometric Analysis. a) leading indicators b)Coincident indicators c) lagging indicators. CLASSIFICATION OF DEMAND FORECASTING
Expert Opinion • The expert opinion method, also known as “EXPERT CONSENSUS METHOD”, is being widely used for demand forecasting. • This method utilizes the findings of market research and the opinions of management executives, consultants, and trade association officials, trade journal editors and sector analysts. When done by • An expert, qualitative techniques provide reasonably good forecasts for a short term because of the expert’s familiarity with the issues and the problems involved. • DELPH I METHOD:- The Delphi method is primarily used to forecast the demand for “NEW PRODUCTS”.
SURVEY A firm can determine the demand for its products through a market survey. It may launch a new products, if the survey indicates that there is a demand for that particular product in the market. For example, Coke in India expanded its product range beyond carbonated drinks, after the company conducted a nationwide survey. The survey revealed that about 80% of the youth preferred to drink tea or coffee rather than carbonated drinks at regular intervals. The remaining 20% preferred to have milk products while only 2% preferred to drink carbonated drinks like coffee. The company is now trying to bring tea and coffee brands to India by installing vending machines. It is also planning to introduce a coconut flavored drink in kerala and a black currant in Tamilnadu named portello.
Market Experiment • Market Experiment can help to overcome the survey problems as they generate data before introducing a product or implementing a policy. • Market Experiments are two types:- 1) Test marketing:- 2) Controlled experiments:-
Test marketing In this case, a test area is selected, which should be a representative of the whole market in which the new product is to be launched. A test area may include several cities and towns, or a particular region of a country or even a sample of consumers. More than one test area can be selected if the firm wants to assess the effects on demand due to various alternative marketing mix. Advertising or packaging can be done in various market areas. Then the demand for the product can be compared at different levels of price and advertising expenditure. In this way, consumer’s response to change in price or advertising can be judged.
DRAWBACKS OF THE MARKET EXPERIMENT • The test experiments are that they are very costly and much time consuming. • If in a test market prices are raised, consumer may switch to the competitor’s products. • It may be difficult to regain lost customers even if the price is reduced to the previous level. Moreover, it is often difficult to select an area, which accurately represents the potential market.
Controlled experiments • Controlled experiments are conducted to the test demand for a new product launched or to test the demands for various brands of a product. • They are selected some consumers.
DRAWBACKS OF THE CONTROLLED EXPERIMENTS 1) The consumers may be biased in the process of selection of a sample of consumers on which experiments is to be performed. 2)The selected consumers may not respond accurately If they come to know that they are a part of an experiment being conducted and their behavior is being recorded.
Time Series Analysis • The time series analysis is one of the most common quantitative method used to predict the future demand for a product. Here the past sales and demand are taken into considerations. • TIME SERIES ANALYSIS IS DIVIDED INTO FOUR CATEGORIES: 1)TREND 2)SEASONAL VARIATIONS. 3)CYCLICAL VARIATIONS. 4)RANDOM FLUCTUATIONS.
METHODS OF TIME SERIES ANALYSIS 1)TREND:- Past data is used to predict the future sales of firm trend is a long term increase or decrease in the variable. 2)SEASONAL VARIATIONS:- It is taken into account the Variations in demand during different seasons. Eg:- The sale of cotton dresses increases in summer. The sale of Woolen clothes increases in winter. 3)CYCLICAL VARIATIONS:- This variations in demand due to the fluctuations in the business cycle – Boom, recession and depression. 4) RANDOM FLUCTUATIONS:- It may happen due to Natural calamities like flood, earthquake, etc. Which cannot be predicted accurately.
BAROMETRIC ANALYSIS • DEFINITION:- “The prediction of turning points • In one economic time series through the use of • Observations on another time series called the • Barometer of the Indicator”. • It can be divided into three groups • 1)Leading indicators. • 2)Coincident indicators. • 3)Lagging indicators.
LEADING INDICATORS • It compares the existing data available. In this • Index includes such as things as average • weekly hours worked and claims for • Unemployment insurance, manufacturers new • orders, stock prices, orders for plant and • equipment, index of consumer expectations, • and real M2 money supply.
Composite Of Leading Indicators • It is useful in understanding the business cycle. CLL • Is primarily intended to identify changes in the • direction of the economy. Components of the Index of • Coincident Indicators are employees on • nonagricultural payrolls, industrial production, • Personal income minus transfer payments, • manufacturing and trade sales.
LAGGING INDICATORS • The lagging indicator composite includes changes in labour costs per unit, ratio of inventory to sales, and figures on installment credit and loans, among other items, In Practical attempts to forecast the future, these indices are among the most important tools available to most organizations, including the government. These indicators provide signals of changes in economic activities like national income or national product, the level of employment and the rate of inflation.
Conclusion • Accurate demand forecasting requires • Product knowledge • Knowledge about the customer • Knowledge about the environment