Download
1 / 20
200 likes | 309 Views
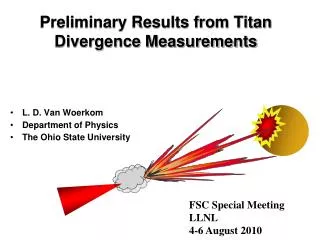
Preliminary Results from Titan Divergence Measurements. L. D. Van Woerkom Department of Physics The Ohio State University. FSC Special Meeting LLNL 4-6 August 2010. Collaborators. FSC. Funding. Office of Fusion Energy Science (OFES) Advanced Concept Exploration Program

E N D
Preliminary Results from TitanDivergence Measurements L. D. Van Woerkom Department of Physics The Ohio State University FSC Special Meeting LLNL 4-6 August 2010
FSC Funding • Office of Fusion Energy Science (OFES) • Advanced Concept Exploration Program • Fusion Science Center (FSC) • This work performed under the auspices of the U.S. Department of Energy by Lawrence Livermore National Laboratory under Contract DE-AC52-07NA27344
Outline • Defining electron beam divergence • Titan Experiments • August 2009 • May 2010 • July 2010 • Conclusions
Bragg crystal CCD Ka (10 mm res.) Ka fluor Laser Rear view buried layer Ka imaging 300 R. Stephens et al, PRE 69 066414 (2004) 30-100J/5 ps 250 200 • Initial e- beam size ~75 mm>>~10 mm laser spot (in agreement with transverse view penetration) • Beam spreads with 40° full angle microns 150 Cone angle 40o Min diameter 75 mm 100 50 0 0 100 200 300 400 500 600 microns
Titan experiment layout Ka detector Kα crystal (south)
B01 series,15 Al/25 Cu/25 Al/25 Al/1mm CH From top right to bottom left: B02-1, no background subtraction; B02-2, couldn’t tell where signal started and background end; B02-3, no background subtraction; B02-4, no background subtraction
Buried Cones -- New • Targets: • Electrical Discharge Machine (EDM) • start w/ solid uniform Al foil, EDM cone holes, glue C get lost Cu Al 2009 targets varied depths 2010 targets const. depths C • Surrounding Al eliminates interface fields • Carbon provides get lost layer As deep as we can image. 200 um? 15° half angle
May 2010, Mingsheng Wei Kα spot size and Kα yield for buried cones
Summary of KB Microscope Results July 2010 H Friesen. July 28, 2010
Everything Aug 2009 Stephens 2004 May 2010 – 30 mm tip May 2010 – 60 mm tip Jul 2010 – KB Q=62 (full)
Source Size • Use Cu K-alpha imager looking at front • Measure spot size for a variety of conditions • From Jan 2008
Our main target was Al/Cu/Al 1000 µm Al 10 µm Al Irradiated side 25 µm Cu
Titan Kα spot diameter as a function of Pulselength 98 J 18 J 104 J
Titan Kα spot diameter as a function of Laser energy @ 0.7 ps
Conclusions • Alignment very difficult • Lots of scatter due to misalignment • Good alignment shows no real difference from flats • Full angle ~ 60-80 degrees • Good News? • Effects of cone structure not dominant • Can use flats for source studies