Download
1 / 16
160 likes | 378 Views
Understanding Piezo based Sensors for an acoustic neutrino detector. ARENA-06, Newcastle, UK. Christopher Naumann, Universität Erlangen-Nürnberg. Acoustic Detection with the ANTARES Telescope. re-fit several ANTARES storeys with acoustics hardware (sensors and DAQ).

E N D
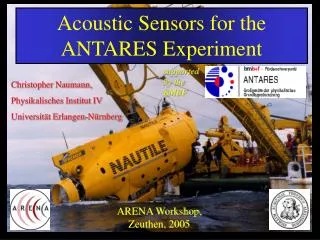
Understanding Piezo based Sensors for an acoustic neutrino detector ARENA-06, Newcastle, UK Christopher Naumann,Universität Erlangen-Nürnberg
Acoustic Detection with the ANTARES Telescope re-fit several ANTARES storeys with acoustics hardware (sensors and DAQ) replace optical sensors with acoustic sensors (schematic) • Aims: • design studies for an acoustic neutrino detector in the deep sea • thorough studies of the acoustic environment in the deep sea: Correlations of the acoustic background over several length scales (<1m up to > 100m)
Aim: Acoustic Sensors • Basic Design of Sensors for the ANTARES acoustics • Sensor = piezo element (disc and/or tube) + pre-amplifier • either encapsulated in polyurethane = > "hydrophone" • or coupled to ANTARES glass sphere = > "acoustic module" internalpre-amplifier cable ANTARES glass sphere 17" (42cm) piezo tube PU coating piezo sensors + pre-amplifiers Signal response and noise characteristics of sensors depend on piezo element try to build model
Electro-Mechanical Equivalent Circuit A F h • Piezo couples mechanical and electrical properties • analogy between forced mechanical and electrical oscillation • mechanical properties of piezo expressible by equivalent electrical properties: LRC p (Cp = electrical capacity between electrodes) = electromechanical coupling constant (depends on material) mechanical oscillator electrical oscillator knowledge of equivalent circuit simple model of piezo
Equivalent Properties (1): Measurement • get all properties from single impedance measurement on piezo element: • apply gaussian signal on voltage divider made of piezo and suitable capacitor • measure signal over capacitor • calculate fourier transforms of signals • from these calculate impedance spectrum of piezo element equiv. circuit with n parallel LRC branches Impedance (k)0.1 1 10 100 Anti-Resonance(Z maximal) Resonance(Z minimal) Fit with Li, Ri and Ci as parameters 10kHz 100kHz 1MHz possible for free and coated or attached piezos
Equivalent Properties (2): Coupling 74mH 666 25pF 74mH 3043 23pF Properties of piezo elements depend on coupling to environment: free piezo: strong resonances • coupling limits movement damping R increases • resonances are weakened - other properties unchanged - coupled: resonances suppressed Impedance (k)0.1 1 10 100 10kHz 100kHz 1MHzFrequency free piezo piezo in sphere sensitivity of piezo element can now be modelled... significant increase of equivalent ohmic resistance damping
Sensitivity (1): Derivation sensitivity resonance 10 10 relat. sensitivity 1 1 0.1 0.1 static sensitivity 0.01 0.01 1kHz 10kHz 100kHz 1MHz • piezoelectric effect: pressure voltage a) ideal piezo converter: U / pindependent of frequency b) real piezo converter: LRC branches and Cp as voltage divider Ua / p frequency dependent(for 0 constant static case) "pressure signal" LRC Cp Ua electrodes real piezo converter, n=1 generalised n > 1 6 LRC branches 1kHz 10kHz 100kHz 1MHz
Sensitivity (2): Comparison sensor signal generator+ oscilloscope calibrated transducer • From Impedance get equiv. parameters sensitivity prediction • Measurement of Sensitivity directly on complete sensor in water tank example: piezo coupled to tank wall -180 Points: MeasurementLine: Prediction sensitivity dB re 1V/µPa -190 data sheet: -192dB=.25mV/Pa -200 10 20 30 40 50 60 70 80 90kHz good agreement between prediction and measurement !
Sensitivity Measurement - Principles frequency domain voltage pulse sent dB (V/V) amplitude (V) transfer spectrum (raw) pulse received fourier transform and divide correct for distance and sender time(µs) • Calibration Chain: • Cross-calibrate transducers using identical pair • calibrate receivers against transducer • can get complete spectrum from onlyone measurement per sensor device ! dBre 1V/µPa corrected sensitivity log frequency (kHz)
Device Calibration – Examples commercial hydrophone with pre-amp (HTI) piezo resonance measurement: -156.7dBre(V/µPa)(=14.6mV/Pa) data sheet: -156dBre(V/µPa) • done for commercial hydrophones (cross-check!) and self-made sensors Acoustic Module (Piezo in Sphere) piezo resonances “plateau” at -120dBre(V/µPa) amplifier cut-off ~ -120dBre(V/µPa)(=1 V/Pa) between 10 and 50kHz 10kHz 100kHz can also invert this process to predict signal shapes...
Prediction of Signal Response raw signal signal response raw signal 2-res. piezo FT log PSD [a.u.] amplitude [a.u.] FT-1 0 100 200 300 400 500 µs 100 200 300 400 500kHz Knowledge of system transfer function allows calculation of signal response: • signal response R(t) = raw signal S(t) convoluted with impulse response I(t) • Thus, calculate signal response by multiplication in fourier domain and subsequent re-transformation into the time domain fourier transform
Application: Response of Complex System example: BIP signal as seen by commercial hydrophone ? a.u. predicted predicted measured sensitivity measured sensitivity impulse response(calc.) measured FT model fit (3 resonances) 400µs apply this knowledge of piezo response also to complex sensor systems: • measure system sensitivity (absolute value only ?) • model piezo response + amplifier characteristics • fit model to measurement: • get full (i.e. complex) transfer function • predict signal shapes => simulate signals and noise !
Model Predictions (2) – Piezo Elongation • inverse piezoelectric effect: applied voltage U = > elongation x (important e.g. for acoustic senders) coupling: current <-> velocity: displacement proportional to integral over voltage for sine signal, frequency : =displacement averaged over face of piezo applicable to arbitrary signals by fourier analysis see Karsten's talk tomorrow behaviour for 0: static casex=U/s
Noise acoustic back-ground in lab -80 Piezo+Amp (measured) -90 PSD [dB re 1V/Hz] -100 op amp piezo element -110 50kHz 100kHz 150kHz • Important in addition to sensitivity: intrinsic noise of sensors = noise of piezo element + amplifier • intrinsic noise of piezo: thermal movement equivalent to thermal (Nyquist) noise of real part of piezo impedance • amplifier noise from OP amps (active) and resistors (passive) noise spectral density (PSD) close to resonances, piezo dominates, below amplifier example: acoustic module sensitivity ca.-115 dB re 1V / µPa=1.8 V / Pa • guidelines for amplifier design • S/N prediction
Conclusions and Outlook • Achievements: • easy description of piezo sensors by electromechanical equivalent properties possible • Acquisition of equivalent parameters by impedance measurement (also for coupled or coated piezo elements) • very good agreement between model predictions and measurements for sensitivity, displacement and noise • possibility to model signal response • Outlook: • use this knowledge to design and build acoustic storeys for ANTARES for operation in the deep sea ! • do extensive simulation / reconstruction studies using realistic system response Thank you for your attention !