Download
1 / 1
10 likes | 154 Views
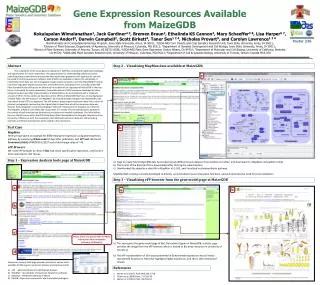
Gene Expression Resources Available from MaizeGDB. Kokulapalan Wimalanathan 1 , Jack Gardiner 4 5 , Bremen Braun 2 , Ethalinda KS Cannon 4 , Mary Schaeffer 3 8 , Lisa Harper 6 7 ,

E N D
Gene Expression Resources Available from MaizeGDB Kokulapalan Wimalanathan1, Jack Gardiner4 5, Bremen Braun2, Ethalinda KS Cannon4, Mary Schaeffer3 8, Lisa Harper6 7, Carson Andorf2, Darwin Campbell2, Scott Birkett4, Taner Sen1 2 4, Nicholas Provart9, and Carolyn Lawrence1 2 4 1Bioinformatics and Computational biology Program, Iowa State University, Ames, IA 50011; 2USDA-ARS Corn Insects and Crop Genetics Research Unit, Iowa State University, Ames, IA 50011; 3Division of Plant Sciences, Department of Agronomy, University of Missouri, Columbia, MO 65211; 4Department of Genetics Development and Cell Biology, Iowa State University, Ames, IA 50011; 5School of Plant Sciences, University of Arizona, Tucson, AZ 85721-0036; 6USDA-ARS Plant Gene Expression Center, Albany, CA 94710; 7Department of Molecular and Cell Biology, University of California, Berkeley, CA 94720; 8USDA-ARS Plant Genetics Research Unit, University of Missouri, Columbia, MO 65211; 9Department of Cell & Systems Biology, University of Toronto, Ontario Canada M5S 3G5 Poster 236 Abstract Step 2 – Visualizing MapMan data available at MaizeGDB The completion of the maize genome sequence in 2009 has created both significant challenges and opportunities for maize researchers. The opportunities for understanding cellular processes underlying maize's phenomenal productivity have never been greater but this opportunity can only be seized if functional genomics software tools (FGSTs) are available to reduce the complexity of multimillion point data sets into manageable images and/or concepts. Currently, MaizeGDB is hosting numerous large gene expression data sets, and furthermore, indications from currently funded NSF Plant Genome Research Projects are that much more data will be deposited at MaizeGDB in the near future. Fortunately for maize researchers, free public domain FGSTs have been developed for other biological systems and their implementation at MaizeGDB can be accomplished with a moderate amount of effort. In this poster, we describe current efforts at MaizeGDB that focus on leveraging two of these FGSTs, the eFP browser1 and MapMan2 by creating strategic linkages from MaizeGDB to the sites where these FGSTs are deployed. The eFP browser projects gene expression data onto a series of pictures (pictographs) representing the original plant tissues from which the expression data was derived. Each pictograph is colored according to the level of expression for the gene on of interest. The MapMan software suite allows the visualization of a variety of functional genomics datasets in the context of well characterized biochemical processes and metabolic pathways. Our initial efforts focus on the 60 tissues within the B73 Maize Gene Atlas3 developed by the Kaeppler laboratory at the University of Wisconsin with the expectation that additional expression data sets characterizing meristem and kernel development will be added in the near future. c a Test Case b MapMan Here we have given an example for differential gene expression using photosynthesis pathway by comparing Whole seed 10 days after pollination, and 13th leaf. We found ferrodoxin1 (fdx1) GRMZM2G122337 had a fold change value of ~45. eFP Browser We used eFP browser to check if fdx1 had tissue specific gene expression, and found it to be restricted to leaf tissues. Step 1 – Expression Analysis tools page at MaizeGDB Page to create fold change (FC) data by comparing two different tissue datasets from Sekhon et al 2011, and download it in MapMan compatible format. The format of the data file that is downloaded after clicking the submit button. Downloaded file added as a data file in MapMan v3.5.1R2, and Visualized in photosynthesis pathway. MapManWeb is being currently developed to directly accommodate tissue comparison functions, and will eliminate the need for local installation Step 3 – Visualizing eFP browser from the gene model page at MaizeGDB a b a b c Please Check out poster #237 for More information about metabolic pathways at MaizeCyc This represents the gene model page of fdx1 (ferrodoxin1) gene at MaizeGDB, and this page provides the image from the eFP browser, which is hosted at Bio array resources in University of Toronto () The eFP representation of 60 tissues presented in Genomewide expression atlas of maize represented by pictures. Red color highlights higher expression, and this is seen mainly leaf tissues. d Expression Analysis tools page provides you links to various tools available for Maize gene expression analysis and expression data. eFP - electronic Fluorescent Pictograph browser MapMan – Visualization of expression datasets in pathways MaizeCyc – Metabolic pathways in Maize PlexDB – Expression resource for plants and plant pathogens References Winter et al (2007). PLoS ONE 2(8): e718. Thimm et al (2004) Plant J. 37:914-39 Sekhon et al (2011) Plant J 66:553-63