Download
1 / 10
100 likes | 225 Views
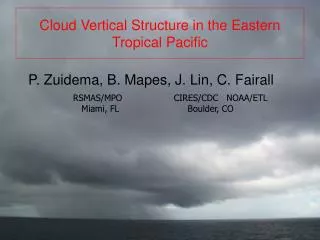
Cloud Vertical Structure in the Eastern Tropical Pacific. P. Zuidema, B. Mapes, J. Lin, C. Fairall. RSMAS/MPO Miami, FL. CIRES/CDC NOAA/ETL Boulder, CO. SUMMARY & CONCLUSIONS:. Dry free-tropospheric air observed during EPIC appears to

E N D
Cloud Vertical Structure in the Eastern Tropical Pacific P. Zuidema, B. Mapes, J. Lin, C. Fairall RSMAS/MPO Miami, FL CIRES/CDC NOAA/ETL Boulder, CO
SUMMARY & CONCLUSIONS: • Dry free-tropospheric air observed during EPIC appears to • originate either from equatorial zone or the shallow oceanic • Costa Rica thermocline zone • advection facilitated through easterly wave dynamics • (implications for convection) • both seen in NCEP analyses; southerly dry air intrusions a • larger-scale feature • Mid-tropospheric inflow layer also seen in simple and CRM • models containing a descending & ascending branch • a new observation is the sublimation of overlying cirrus by • the dry layer; precip radar and cloud radar provide consistent • estimates of the diabatic cooling (60 +- 40 K/day). • NCAR CAM3 model appears to capture the dry air intrusions, • GFDL model less well Submitted paper available through http://www.rsmas.miami.edu/users/pzuidema/publications.html
Time series of coincident sonde RH at 95W, 10N Hurricane Juliette RHB leaves 10N, arrives 5N
EPIC (21 day) Normalized frequency by height of Relative humidity and cloud radar reflectivities • Cloud radar: • attenuates with height, • ~ 20 dBZ maximum • point measurement but continuous (every minute) Note toga-coare mean (Ciesielski et al. 2003)
Mid-tropospheric dry air during EPIC associated with easterlies or southerlies. EPIC meridional wind Easterly dry air layers more Frequent, but less dramatic and not as extensive in ncep NCEP 1990-2000 Sept. mean RH & V along 110 W RH < 30%, 4-8km Strong southerly Or Weak northerly component meridional zonal
Sources of dry air both to south and east, but equatorial region a larger-scale, more reliable, source. The ~ 7km altitude preference for (dry air) inflow seen in models. 1998-2003 September climatology, TMI precipitation (color; mm/day) And SST (contours). Reproduced from Xie et al., (2005; Jclim)
Sept. 20 - 24 time series Easterly dry air Southerly dry air: Sublimating overlying Cloud. Diabatic cooling of ~ 60 K/day from precip radar, eq. to IWC of 0.20 g m-3 from cloud radar
Divergence from ice sublimation much larger than from evaporation Of surface-based convection, reflecting larger cirrus cloud fraction, And perhaps a dynamical effect: horizontal divergence will act to simultaneously spread and thin The (top of the) dry layer, which is now cooler and moister Frequency of Layers with Lapse rates > -5, -4, -3 K/km
SUMMARY & CONCLUSIONS: • Dry free-tropospheric air observed during EPIC appears to • originate either from equatorial zone or the shallow oceanic • Costa Rica thermocline zone • advection facilitated through easterly wave dynamics • (implications for convection) • both seen in NCEP analyses; southerly dry air intrusions a • larger-scale feature • Mid-tropospheric inflow layer also seen in simple and CRM • models containing a descending & ascending branch • a new observation is the sublimation of overlying cirrus by • the dry layer; precip radar and cloud radar provide consistent • estimates of the diabatic cooling (60 +- 40 K/day). • NCAR CAM3 model appears to capture the dry air intrusions, • GFDL model less well