Download
1 / 19
190 likes | 204 Views
Explore future water and wastewater projections, multiple scenarios, and spatial results for regional planning with GIS support. Validate data, assess growth, and update management plans with collaborative efforts. Access data online via GIS map viewer with password-protected features.

E N D
Scenario Planning for Water and Wastewater in the Truckee Meadows WRWC Agenda Item 9 Jeremy M. Smith, TMRPA Jim Smitherman, WRWC 8/17/2016
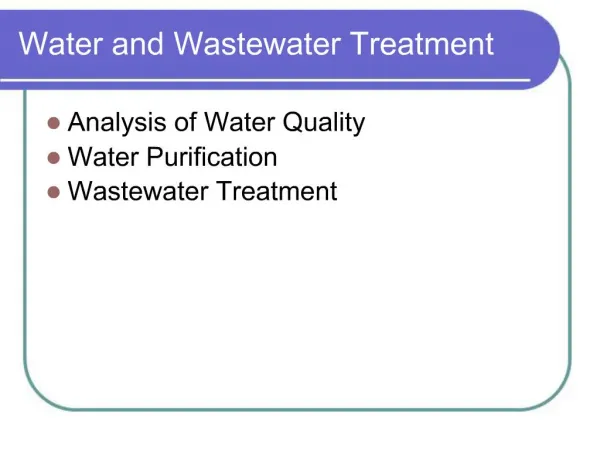
Outline • Background • Future growth outlook and spatial modeling • TMWA water use factors and model calculations • Water demand • Winter water use (proxy for wastewater) • Validation with observed data • Projection of future water demand and wastewater generation • Multiple scenarios • Spatially-enabled results
TMRPA Partnership with WRWC • GIS support for water and wastewater planning • Regional Water Management Plan • Regional Plan • Scenario planning • Consensus forecast • Spatial modeling of population and employment forecasts • TMRPA housing study • Pattern linked to cost of infrastructure
Washoe County Consensus Forecast • Assessment of forecasted population and employment growth; performed every 2 years by TMRPA to inform planning efforts across the region. • Sources • Nevada State Demographer • Truckee Meadows Water Authority • Woods and Poole • IHS – Global Insight
Tracking Current and Future Land Use Tracking employees by business location Tracking residential development present and future potential Monthly Process for Updating Land Use Fabric
Spatial Allocation of Predicted Growth • Translate time series projections to spatial allocation of housing units and employment • Rule-based allocation model that uses an overall suitability score • Parcel-based • Dual-mode suitability model • Population • Employment • Model results can be aggregated to any geography • Traffic analysis zones • Wastewater treatment facility service areas • TMWA fee areas • Etc.
TMRPA Housing Study – 4 Scenarios • Extensive research and outreach on past housing trends (since 2000) and future outlooks on housing demand • Evaluation of 4 housing growth scenarios that simulate different spatial and temporal patterns • Scenario 1aRecent trends + Consensus Forecast • Scenario 1bRecent trends + EDAWN EPIC Forecast • Scenario 2aCompact development + Consensus Forecast • Scenario 2bCompact development + EDAWN EPIC Forecast • Learn more: www.tmrpa.org/housingstudy/ www.tmrpa.org/tmrpa-maps/
TMWA Total Water Use Coefficients • Water use coefficients are taken directly from the TMWA 2016-2035 Water Resource Plan • Weighted Average gives more weight to hydrobasins that have more units or meters in them
Methods – Water Demand Calculations • We chose a weighted-average approach to reflect the impact that more dwelling units and/or employees have on the overall average of water demand or wastewater generation • We are still in process to compare our modeled water demand with existing demand values from TMWA Non - Residential Residential
TMWA Indoor Water Use Coefficients • Water use coefficients are derived from billing records from 2009-2015 • Indoor usage only • Winter months from December - March • Weighted Average gives more weight to hydrobasins that have more units or meters in them
Methods – Wastewater Generation Calculations • We chose a weighted-average approach to reflect the impact that more dwelling units and/or employees have on the overall average of water demand or wastewater generation • Our initial calculations indicate that the weighted approaches had produced results more in line with observed flows Non - Residential Residential
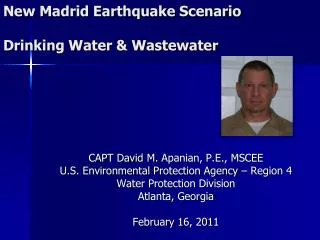
Regional Wastewater Generation – Validation with Observed (2015) Observed Calculated Comparison
Conclusions • These data are now available to assist Jim Smitherman with the update of the Regional Water Management Plan • We have worked closely to ensure Jim’s needs are met and that planning efforts across the region are aligned • We have the capacity to evaluate other scenarios and to conceptualize differences using other geographic boundaries (e.g. fee areas) • Although this delivery marks the end of our interlocal agreement around scenario planning, this is not the end of our relationship • We are committed to continued collaboration with water and wastewater staff to calibrate model assumptions and to evaluate alternate scenarios, especially as our regional outlook of the future changes • Capability for online dissemination of these data (and other related data) via our GIS map viewer products • Password protected access • Some printing and map composition functionality • Access to tabular data