Download
1 / 31
310 likes | 332 Views
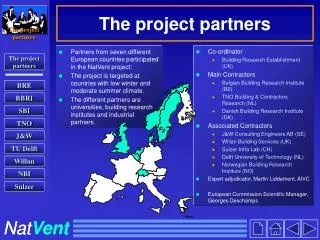
Project partners- FishFIT-Monitoring project. Leibniz-Institute of Freshwater Ecology and Inland Fisheries, Berlin. ELBAU Elektronik Bauelemente GmbH Berlin. Institute of Agricultural and Urban Ecological Projects (IASP).

E N D
Project partners- FishFIT-Monitoring project Leibniz-Institute of Freshwater Ecology and Inland Fisheries, Berlin ELBAU Elektronik Bauelemente GmbHBerlin Institute of Agricultural and Urban Ecological Projects (IASP) Fraunhofer Institute of Reliability, System Design and Integration (IZM)
Topics • Situation in European Aquaculture • Objectives of the Project • Technical Principle of the FischFIT- Monitoring • Chronobiological Methods of the Data Analysis • Results of the First Measurements • Perspectives
Situation in European Aquacultur • Young and dynamic branch of animal production • Rather high risk of losses based on different reasons • Intensive production with high stocking densities • Rather bad observing and monitoring conditions • High educational level results in high acceptance for innovations • Economical potential, minimise losses, high quality products
HealthanalysisandMonitoring Recently used methods to analyse health andto prevent losses: • Semi-automatic recording of water supply and water quality parameters • Observation and evaluation of fish health via activity, food uptake and daily losses • Occasionally microscopical parasitologic and haematologic examinations by a veterinarian ???
? ? ? ? Objectives to improve the situation • Development of an innovative measurement and diagnostic system for an early and detailed analysis of fish health, fitness and welfare in aquaculture • Recording and telemetric transmission of physiologic data of monitor-fish by autonomous, injectable microsensor systems • Automated longtime monitoring and control of fish stocks • Reliable and cost effective health diagnostic system, indicating of physiological alterations and / or behavioural irregularities in fishes
PrincipleofFischFIT - Monitoring • Using implantable electronic multi-sensors • Measurement of physiological and behavioural parameters directly in the animal • Data evaluation via diagnosis- software • To do: • Technically develop and test the sensor • Set up experiments with defined stress situations and diseases • Develop data analysis solutions
Design andfunctionofthesensor • Miniaturised multisensor (eGrain) • As small as possible (25 x 6 x 2.5 mm) • Injectable • Long time operation - 3 years + rechargeable Pressure and temperature sensor Electrodesformeasuring electricpotentials 3D-acceleration Communication unit processor Biocompatible housing battery/accumulator
battery / accumulator battery / accumulator communication unit processor communication unit processor 3D - acceleration 3D - acceleration electrodes for measuring electrodes for measuring pressure and pressure and electric potentials electric potentials temperatur sensor temperatur senor biocompatible housing biocompatible housing Position of the sensor • The sensors are implanted ventrally into the body cavity between pectoral and ventral fins Implanted sensor-eGrains
Measuringparameters • Parameters and physiological or behavioural processes or functions
Fish-Positions TaggedFish Distribution of fish and sensor distances • Theoretical distribution of fish in a rearing tank • Amount of monitor fish (between 1-5 % of the stock) • Representative due to high stocking densities and epedemical outbreaks 200 100 0 0 100 200 300 400 500 600 700 800 • Mass kg/Fisch 0,5 • Fish/m³ 100 • Fish number 2000 • Tanks size 8x2x1,25 m • Tank volume 20 m³ • Stocking density 50 kg/m³
Fish-Positions TaggedFish Distribution of fish and sensor distances • Modelled distribution of tagged fishes in a rearing tank • Amount of monitor fish (between 1-5 % of the stock) • Representative due to high stocking densities and epedemical outbreaks 200 100 0 100 200 300 400 500 600 700 800 • Mass kg/Fisch 0,5 • Fish/m³ 100 • Fish number 2000 • Tanks size 8x2x1,25 m • Tank volume 20 m³ • Stocking density 50 kg/m³
Fish-Positions TaggedFish Distribution of fish and sensor distances • Modelled distribution of tagged fishes in a rearing tank • Amount of monitor fish (between 1-5 % of the stock) • Representative due to high stocking densities and epedemical outbreaks 200 100 0 0 100 200 300 400 500 600 700 800 • Mass kg/Fisch 0,5 • Fish/m³ 100 • Fish number 2000 • Tanks size 8x2x1,25 m • Tank volume 20 m³ • Stocking density 50 kg/m³
Fish-Positions TaggedFish Distribution of fish and sensor distances • Modelled distribution of tagged fishes in a rearing tank • Amount of monitor fish (between 1-5 % of the stock) • Representative due to high stocking densities and epedemical outbreaks 200 100 0 0 100 200 300 400 500 600 700 800 • Mass kg/Fisch 0,5 • Fish/m³ 100 • Fish number 2000 • Tanks size 8x2x1,25 m • Tank volume 20 m³ • Stocking density 50 kg/m³
Fish-Positions TaggedFish Distribution of fish and sensor distances • Modelled distribution of tagged fishes in a rearing tank • Amount of monitor fish (between 1-5 % of the stock) • Representative due to high stocking densities and epedemical outbreaks 200 100 0 0 100 200 300 400 500 600 700 800 • Mass kg/Fisch 0,5 • Fish/m³ 100 • Fish number 2000 • Tanks size 8x2x1,25 m • Tank volume 20 m³ • Stocking density 50 kg/m³
Experimental design (1) • Environmental factors • Pathogens • Technology related influences ... Light Handling Feeding Temperature competition Water quality oxygen Swimming activity Heart frequency Parasites / Bacteria CO 2 Breath frequency Viruses pH NH 4 skin-/tissue potencial
Experimental design (2) • Aquarium (lateral view) with environmental measurement technique, receiver station and 3D-video recording • About 1.5 x 1.5 m • Feeding device • Recirculation System with mechanical and biological filtration • Open recirculation added fresh water
Experimental design (3) • Aquarium (top view) with environmental measurement technique and inductor coil for recharging of the sensor node • Situated in a climatic chamber • Dimmable light up to 1400 lx • IR-Light (for night phase)
Physiological and behavioural parameters Statusanalysis Synchroni-sationanalysis bio.stream - Software Event recognition unit Data transfer and analysis
First Results • Exemplary data series of measured skin resistance and acceleration values 1 0,8 Vegetative reaction / Behavioural reaction Fish Gustav 41 0,6 3000 0,4 2500 0,2 0 2000 - 0,2 1500 - 0,4 Skin resistance[Ohm] 3D accelaration[g] - 0,6 1000 - 0,8 500 - 1 0 16:06:00 16:06:10 16:06:20 16:06:30 16:06:40 16:06:50 16:07:00 16:07:10 16:07:20 16:07:30 16:07:40 16:07:50 16:08:00 16:08:10 16:08:20 16:08:30 16:08:40 16:08:50 HW 3d - z 3d - y
Chronobiology of physiological functions Chronobiological data analysis, rhythmic regulation of the parameter physiological function tends to oscillate between maximum and minimum value period length depends on the activity status of the organism stressed organism: short period length, fast regulation, fast reaction relaxed organism: longer period length, slow regulation, slow reaction
Chronobiological data analysis • Single parameter analysis bio.stream - Software Original data Trend elimination Model functions of time series ACF, Cosinor, Powerspectrum Comparison of models Selection of the best fit Stability analysis Crosscorrell. model/data Stable / instable periods Dynamic analysis of periods moving main period length Frequency distribution Periods in a time window Visual determination of Regulatory states (Selection of training series) Training phase Neuronal Network Regulatory states Regulatory pattern
Results (2) • Plot of the assigned regulatory states for measured acceleration data Locomotor behaviour Locomotory behaviour Fish Otto 3 09.07.2009 0 10 20 30 Regulation state 40 50 60 70 80 15:19:54 15:20:54 15:21:54 15:22:54 15:23:54 15:24:54 15:25:54 15:26:54 15:27:54 15:28:54 15:29:54 15:30:54 Time x y z
2 - 2:30 pm frequency (%) adaptive concentrated dysregulated disintegrated deactivated activated Regulatorypattern (1) • Frequency pattern of the regulatory states of all measured parameters
5 - 5:30 pm frequency (%) adaptive concentrated dysregulated disintegrated deactivated activated Regulatory pattern (2) • Frequency pattern of the regulatory states of all measured parameters
9 - 9:30 pm frequency (%) adaptive concentrated dysregulated disintegrated deactivated activated Regulatory pattern (3) • Frequency pattern of the regulatory states of all measured parameters
Summary • Development of the technical solution and the data analysis procedure for • Improvement of health monitoring and disease prophylaxis in aquaculture • Technological optimisation and certification of aquaculture production processes • Improvement of investigation methods of physiology, behavior and welfare in fish related research
Next steps • Investigation of regulatory patterns in typical stress situations • Combination of regulatory patterns analysis with behavioural video monitoring • Monitoring to enable forecasts of behavioural pattern • Visualisation and user communication for practical use • Visualisation of alarm situations via traffic light system • Data-transfer to already existing environmental monitoring systems • Integration in a fish farm management system • Complex evaluation of health situations including environmental and technological parameters by an expert system
Further perspectives • Monitoring in bigger systems like rearing ponds • Physiologic field telemetry in lakes and rivers • Tracking of fish schools in pelagic areas