Download
1 / 27
270 likes | 358 Views
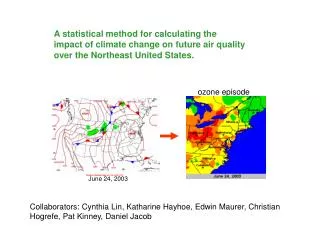
L. F. C. Air Quality, Emissions, Growth, and Change A Method to Prescribe a Desirable Future. Michael Chang Farhan Akhtar Ann Carpenter Jim Chapman Jennifer Chirico Doug Noonan Ted Russell. 2009 Region 4 Modelers Workshop. March 19, 2009. Our perspective going in….

E N D
L F C Air Quality, Emissions, Growth, and Change A Method to Prescribe a Desirable Future Michael Chang Farhan Akhtar Ann Carpenter Jim Chapman Jennifer Chirico Doug Noonan Ted Russell 2009 Region 4 Modelers Workshop March 19, 2009
Our perspective going in… • Forecasting is hard. • Predictions are uncertain. • Sometimes future outcomes are undesirable.
Our approach… • Predict as little of the future as possible. • Plan as much of the future as possible. • Make air quality an input into the urban development process rather than an outcome of it. • What air quality do we want in the future? • What emissions yield the desired air quality? • What land uses fit the emissions profile?
What Air Quality Do We Want? • Depends on who you ask… • Mothers of asthmatic children? • Absentee owners of smokestack industries? • Beleaguered politicians? • Assume a consensus could be reached (a lengthy exercise in public policy). • For testing purposes only, we asked an economist. • Other scenarios.
What air quality do we want? An economic approach 2000 Demand more 2010 Supply DAQ=10% NAAQS 2020 Cost 2030 Market Equilibrium 2040 less 2050 worse Air Quality better
What emissions yield the desired air quality? • The Forward Method • “Predict the change in emissions and you can predict the change in air quality.” • DEP = Dc • where • DE is the change in emissions, • P is a transformation matrix, and • Dc is the change in air quality
What emissions yield the desired air quality? • The Inverse Method • “State the change in air quality desired and you can calculate the change in emissions needed.” • DE= P-1Dc • where • DE is the change in emissions, • P is a transformation matrix, and • Dc is the change in air quality
What emissions yield the desired air quality? • The Inverse Method: Kalman Filter • “State the change in air quality desired and you • can calculate the change in emissions needed.” • DE= CPT(PCPT+N)-1Dc • where • DE is the change in emissions, • P is a transformation matrix, • Dc is the change in air quality, • N is the noise matrix (degree to which people agree) • C is the covariance matrix (degree to which sources can change) (subject to agreement) ^ ^ (constrained by what can and cannot be readily changed)
What emissions yield the desired air quality? Original Mobile Source NOx Original Ozone Needed emissions reductions to achieve desired O3 Needed Mobile NOx for desired O3 DO3 = -10% (desired)
What land uses fit the emissions profile? Household Travel Survey • 13 county Atlanta, GA region • 8,069 households • 17,500+ people • 116,000+ trips • 64,600+ locations • 15,000+ vehicles SMARTRAQ: land use as a predictor of household transportation related emissions Strategies for Metropolitan Atlanta Regional Transportation and Air Quality (completed, 2004) We continue the “inverse” theme and use the SMARTRAQ database to identify land use characteristics that are suited for a stated (desired) emissions budget.
What land uses fit the emissions profile? Not Everyone Pollutes the Same
Key findings between land use and travel emissions • Residential density, intersection density, and land use mix shown to have a significant inverse association with per capita NOx emissions. • Chapman, Jim , Frank, Lawrence (2004). “Integrating Travel Behavior and Urban Form Data to Address Transportation and Air Quality Problems in Atlanta.” Final Report. Deliverable # V.30 under GDOT Research Project No. 9819, Task Order 97-13, 267. • Found a single index of walkability (incorporating land use mix, street connectivity, net residential density, and retail floor area ratios) to be significantly negatively associated with per capita NOx emissions. • Frank, Lawrence, Sallis JF, Conway T, Chapman J, Saelens B, Bachman W (2006). “Multiple Pathways from Land Use to Health: Walkability Associations with Active Transportation, Body Mass Index, and Air Quality.” Journal of the American Planning Association Vol. 72 No. 1. • Residential density found to have a significant negative relationship with household vehicle emissions. • Frank, L. D., Stone, B., & Bachman, W. (2000). Linking land use with household vehicle emissions in the central Puget Sound: Methodological framework and findings. Transportation Research D, 5 (3), 173–196.
Net Residential Density • # residential units / residential acre • Range of 0 - 13.4 units/ac Data source: 1999 LandPro land cover, 2000 Census
Net Residential Density 3.7 units/ac 13.4 units/ac
Intersection Density • # intersections (at least 3-way) / km2 • Range of 0 - 60.9 int/km2 Data source: 2000 GA DOT roads
Intersection Density 43.5 int/km2 6.1 int/km2
Use Mix Index • Relative evenness of commercial, office, and residential square footage • Range of 0 (single land use) – 1 (perfectly mixed) Data source: county tax assessors’ data
Use Mix Index 0.97 0.00
Comparison Areas Sandy Springs vs. Dunwoody • Selected to highlight regional differences in emissions while controlling for transportation accessibility
Use Mix Index Sandy Springs Dunwoody 0.34 0.11
Net Residential Density Sandy Springs Dunwoody 3.23 units/ac 1.41 units/ac
Intersection Density Sandy Springs Dunwoody 15.75 int/km2 21.88 int/km2
Atlanta 2044? Atlanta 2004 Atlanta 1964 Planning Long-term Air Quality Forecasting Air Quality, Emissions, Growth, and Change: A Method to Prescribe a Desirable Future Emissions Air Quality Values Development Planning Emissions Development Planning Air Quality Values
will we want the air we have? in the year 2050… or have the air we want? February 13, 2009