Download
1 / 23
230 likes | 369 Views
This article explores Earth's internal structure by examining seismological data and compositional models. It discusses the validity of existing models and their compatibility with seismic tomography results. Using probabilistic tomography and various geophysical parameters, the study presents evidence for chemical heterogeneity within the mantle. It also analyzes how variations in density and temperature correlate with seismic velocities, providing insight into the underlying compositional anomalies. Current conclusions challenge traditional interpretations, paving the way for new understanding of Earth's geology.

E N D
The Earth in three dimensions From seismology to composition and temperature
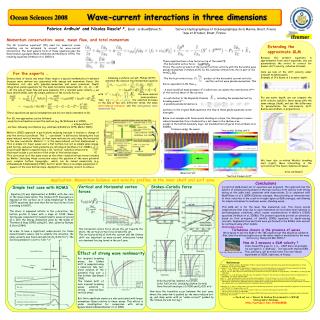
Is this the only model compatible with the data? If we project some chosen model onto the null space of the forward operator Then add it to original model. The same data fit is guaranteed! Deal et al. JGR 1999
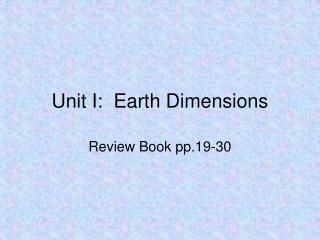
Radial variation of dlnVs/dlnVp most popular diagnostic Robertson and Woodhouse, 1996 ‘’The observations of RW96 and SD97 reinforce the conclusion that we should seek a compositional interpretation of tomographically observed velocity anomalies in the lower mantle’’ Stacey, 1998.
Interpretation: ratios Vp=[(K+4/3G)/r] Vs=[G/r] The ratio dlnVs/dlnVp=2.25 if the only variation is in G for a Poisson solid. This is also observed in laboratory experiments for thermal variations.
Average ratios of dlnVs/dlnVp are not useful if more than one cause is at play. It can best give a qualitative indication. The full histogram gives statistical evidence of compositional anomalies, but they can not be located in the Earth
Direct inversion Example of a descending slab Using lnVp/T=-1.9x10-5, lnVs/T=-3.0x10-5 lnVp/X =0.056 and lnVs/X=-0.025, X is the perovskite content Taking dlnVp=0.003 and dlnVs=0.006, we find dT=-190K and dX –0.011 which is -1.1% perovskite variation, as expected
Averaged and gravity filtered models over 15x15 degree equal area caps • Likelihoods in each cap are nearly Gaussian • Most likely model (above one standard deviation) • Uniform uncertainties • dlnVs=0.12 % • dlnVΦ=0.26 % • dlnρ=0.48 %
Likelihood of correlation between seismic parameters Evidence for chemical heterogeneity Vs-VF
Incompressibility: KS=-V(P/V)S Thermal expansivity a=-1/r(r/T)P Grüneisen parameter (P/T)V=gCV/V Anderson-Grüneisen : d=-1/aKs(Ks/T)P Anderson-Grüneisen : e=-1/aKs(G/T)P d = Ks’-1-g+q Ks’~4, q~1, g~1, e>6 dlnr/dlnVs~0.2
Likelihood of rms-amplitude of seismic parameters Evidence for chemical heterogeneity RMS density
Likelihood of correlation between seismic and thermo-chemical parameters in the lowermost mantle
Ricard et al. JGR 1993 • Lithgow-Bertelloni and Richards Reviews of Geophys. 1998 • Superplumes
How good is tomography