Download
1 / 1
20 likes | 194 Views
Fibromyalgianess, Systemic Lupus Erythematosus & the Evaluation of SLE Activity R Katz 1 , M Petri 2 , E Karlson 3 , G Alarcón 4 , E Chakravarty 5 , J Goldman 6 , F Wolfe 7 , SLE in the Community Study Group

E N D
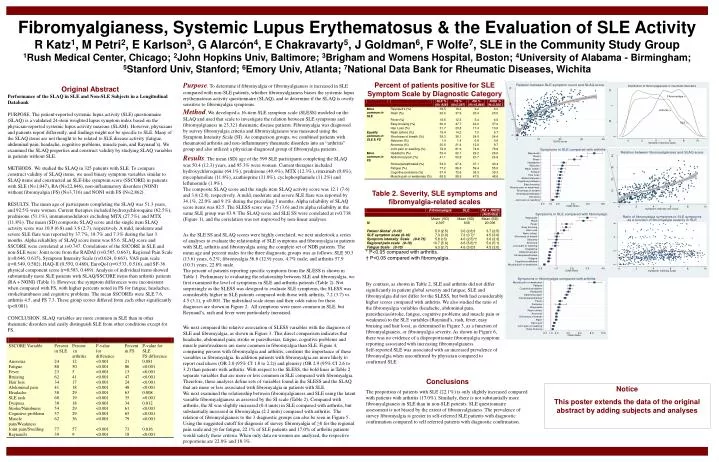
Fibromyalgianess, Systemic Lupus Erythematosus & the Evaluation of SLE ActivityR Katz1, M Petri2, E Karlson3, G Alarcón4, E Chakravarty5, J Goldman6, F Wolfe7, SLE in the Community Study Group 1Rush Medical Center, Chicago; 2John Hopkins Univ, Baltimore; 3Brigham and Womens Hospital, Boston; 4University of Alabama - Birmingham; 5Stanford Univ, Stanford; 6Emory Univ, Atlanta; 7National Data Bank for Rheumatic Diseases, Wichita Purpose. To determine if fibromyalgia or fibromyalgianess is increased in SLE compared with non-SLE patients, whether fibromyalgianess biases the systemic lupus erythematosus activity questionnaire (SLAQ), and to determine if the SLAQ is overly sensitive to fibromyalgia symptoms. Method. We developed a 16-item SLE symptom scale (SLESS) modeled on the SLAQ and used that scale to investigate the relation between SLE symptoms and fibromyalgianess in 23,321 rheumatic disease patients. Fibromyalgia was diagnosed by survey fibromyalgia criteria and fibromyalgianess was measured using the Symptom Intensity Scale (SI). As comparison groups, we combined patients with rheumatoid arthritis and non-inflammatory rheumatic disorders into an “arthritis” group and also utilized a physician-diagnosed group of fibromyalgia patients.. Percent of patients positive for SLE Symptom Scale by Diagnostic Category Original Abstract Performance of the SLAQ in SLE and Non-SLE Subjects in a Longitudinal Databank PURPOSE. The patient-reported systemic lupus activity (SLE) questionnaire (SLAQ) is a validated 24-item weighted lupus symptom index based on the physician-reported systemic lupus activity measure (SLAM). However, physicians and patients report differently, and findings might not be specific to SLE. Many of the SLAQ items are not thought to be related to SLE disease activity (fatigue, abdominal pain, headache, cognitive problems, muscle pain, and Raynaud’s). We examined the SLAQ properties and construct validity by studying SLAQ variables in patients without SLE. METHODS. We studied the SLAQ in 325 patients with SLE. To compare construct validity of SLAQ items, we used binary symptom variables similar to SLAQ items and constructed an SLE-like symptom score (SSCORE) in patients with SLE (N=1,047), RA (N=22,846), non-inflammatory disorders (NONI) without fibromyalgia (FS) (N=3,716) and NONI with FS (N=2,862). RESULTS. The mean age of participants completing the SLAQ was 51.3 years, and 92.5% were women. Current therapies included hydroxychloroquine (62.5%), prednisone (51.1%), immunomodulators excluding MTX (27.7%), and MTX (11.8%). The mean (SD) composite SLAQ score and the single item SLAQ activity score was 10.9 (6.8) and 3.6 (2.7), respectively. A mild, moderate and severe SLE flare was reported by 37.7%, 18.7% and 7.3% during the last 3 months. Alpha reliability of SLAQ score items was 85.6. SLAQ score and SSCORE were correlated at r=0.747. Correlations of the SSCORE in SLE and non-SLE were: Joint score from the RADAI (r=0.585, 0.663), Regional Pain Scale (r=0.646, 0.615), Symptom Intensity Scale (r=0.624, 0.663), VAS pain scale (r=0.549, 0.502), HAQ-II (0.550, 0.460), EuroQol (r=0.533, 0.516), and SF-36 physical component score (r=0.583, 0.469). Analysis of individual items showed substantially more SLE patients with SLAQ/SSCORE items than arthritis patients (RA + NONI) (Table 1). However, the symptom differences were inconsistent when compared with FS, with higher percents noted in FS for fatigue, headaches, stroke/numbness and cognitive problems. The mean SSCOREs were SLE 7.6, arthritis 4.5, and FS 7.3. These group scores differed from each other significantly (p<0.001). CONCLUSION. SLAQ variables are more common in SLE than in other rheumatic disorders and easily distinguish SLE from other conditions except for FS. Results. The mean (SD) age of the 599 SLE participants completing the SLAQ was 50.4 (12.3) years, and 95.3% were women. Current therapies included hydroxychloroquine (64.1%), prednisone (49.4%), MTX (12.3%), rituximab (0.8%), mycophenolate (11.8%), azathioprine (11.0%), cyclophosphamide (11.2%) and leflunomide (1.9%). The composite SLAQ score and the single item SLAQ activity score was 12.1 (7.6) and 3.8 (2.8), respectively. A mild, moderate and severe SLE flare was reported by 34.1%, 22.0% and 9.1% during the preceding 3 months. Alpha reliability of SLAQ score items was 82.5. The SLESS score was 7.5 (3.6) and its alpha reliability in the same SLE group was 83.9. The SLAQ score and SLE SS were correlated at r=0.738 (Figure 1), and the correlation was not improved by non-linear analyses. Table 2. Severity, SLE symptoms and fibromyalgia-related scales As the SLE SS and SLAQ scores were highly correlated, we next undertook a series of analyses to evaluate the relationship of SLE symptoms and fibromyalgia in patients with SLE, arthritis and fibromyalgia using the complete set of NDB patients. The mean age and percent males for the three diagnostic groups was as follows: SLE 50.3 (13.6) years, 6.2%; fibromyalgia 56.8 (12.9) years, 4.7% male; and arthritis 57.9 (10.3) years, 22.8% male. The percent of patients reporting specific symptoms from the SLESS is shown in Table 1. Preliminary to evaluating the relationship between SLE and fibromyalgia, we first examined the level of symptoms in SLE and arthritis patients (Table 2). Not surprisingly as the SLESS was designed to evaluate SLE symptoms, the SLESS was considerably higher in SLE patients compared with those with arthritis, 7.2 (3.7) vs. 4.5 (3.1), p <0.001. The individual scale items and their odds ratios for these diagnoses are shown in Figure 2. All symptoms were more common in SLE, but Reynaud’s, rash and fever were particularly increased. * P<0.05 compared with arthritis. † P<0.05 compared with fibromyalgia. By contrast, as shown in Table 2, SLE and arthritis did not differ significantly in patient global severity and fatigue; SLE and fibromyalgia did not differ for the SLESS, but both had considerably higher scores compared with arthritis. We also studied the ratio of the fibromyalgia variables (headache, abdominal pain, paresthesias/stroke, fatigue, cognitive problems and muscle pain or weakness) to the SLE variables (Raynaud’s, rash, fever, easy bruising and hair loss), as determined in Figure 3, as a function of fibromyalgianess, or fibromyalgia severity. As shown in Figure 6, there was no evidence of a disproportionate fibromyalgia symptom reporting associated with increasing fibromyalgianess. Self-reported SLE was associated with an increased prevalence of fibromyalgia when unconfirmed by physician compared to confirmed SLE. We next compared the relative association of SLESS variables with the diagnosis of SLE and fibromyalgia, as shown in Figure 3. This direct comparison indicates that headache, abdominal pain, stroke or paresthesias, fatigue, cognitive problems and muscle pain/weakness are more common in fibromyalgia than SLE. Figure 4, comparing persons with fibromyalgia and arthritis, confirms the importance of these variables in fibromyalgia. In addition patients with fibromyalgia are more likely to report oral ulcers (OR 2.0 (95% CI 1.8 to 2.2)) and pleurisy (OR 2.9 (95% CI 2.6 to 3.2) than patients with arthritis. With respect to the SLESS, the bold lines in Table 2 separate variables that are more or less common in SLE compared with fibromyalgia. Therefore, these analyses define sets of variables found in the SLESS and the SLAQ that are more or less associated with fibromyalgia in patients with SLE. We next examined the relationship between fibromyalgianess and SLE using the latent variable fibromyalgianess as assessed by the SI scale (Table 2). Compared with arthritis, the SI was slightly increased (0.4 units) in SLE compared with arthritis, but substantially increased in fibromyalgia (2.2 units) compared with arthritis. The relation of fibromyalgianess to the 3 diagnostic groups can also be seen in Figure 5. Using the suggested cutoff for diagnosis of survey fibromyalgia of ≥8 for the regional pain scale and ≥6 for fatigue, 22.1% of SLE patients and 17.0% of arthritis patients would satisfy those criteria. When only data on women are analyzed, the respective proportions are 22.0% and 18.3%. Conclusions The proportion of patients with SLE (22.1%) is only slightly increased compared with patients with arthritis (17.0%). Similarly, there is not substantially more fibromyalgianess in SLE than in non-SLE patients. SLE questionnaire assessment is not biased by the extent of fibromyalgianess. The prevalence of survey fibromyalgia is greater in self-referred SLE patients with diagnostic confirmation compared to self referred patients with diagnostic confirmation. Notice This poster extends the data of the original abstract by adding subjects and analyses